|
KROSA was the fourteenth named storm of the 2019 Pazific Typhoon Season. With a maximum wind speed of 185 kph, it
was ranked as Category 3 typhoon, but after weakening it made landfall in Japan as Tropical Storm.
Development and trajectory
The cyclone developed from a depression near Mariana Island on 05 August. Already on 06 August the system
reached tropical storm stuts and received the name KROSA. On 08 August it reached Typhoon strength before
it rapidly intensified and reached its maximum strength within the same day. On 08 August at 12 UTC,
Category 3 Typhoon had wind speeds of 185 kph and gusts of up to 215 kph. The core pressure decreased by
40 hPa within 12 hours (from 07.08. 15 UTC until 08.08. 03 UTC). The minimum core pressure of KROSA was
950 hPa.
|
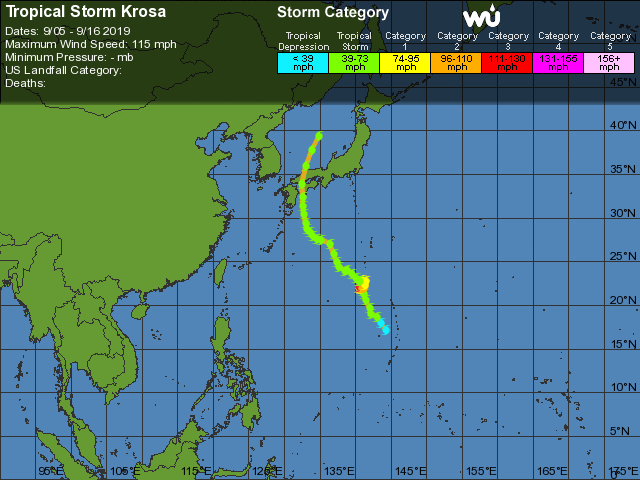
KROSAs Trajecotory from 05 August until 16 August
Wunderground
|
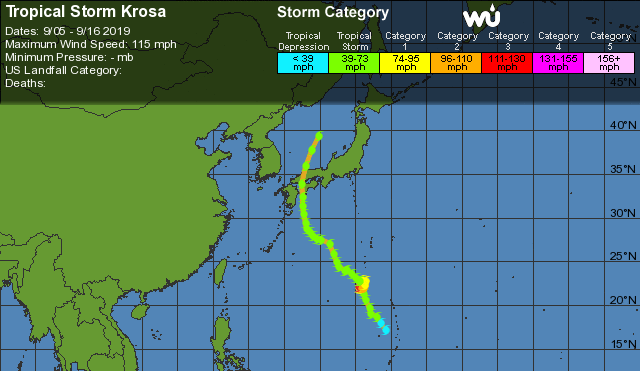 |
From 07 to 11 August the typhoon was almost stationary. In the water masses beneath the cyclone, cold water
from low layers was whirled due to the high wind speeds and the resulting waves therefrom. This led to
deceasing sea surface temperatures, so that the oceanic water in this area could no longer provide enough
energy to maintain the intensity of the typhoon.
As a result, KROSA weakened into a tropical storm. It then restarted to move northwest again at moderate speed of
about 20 kph, with its core pressure and mean wind speed remaining almost constant over a period of multiple days
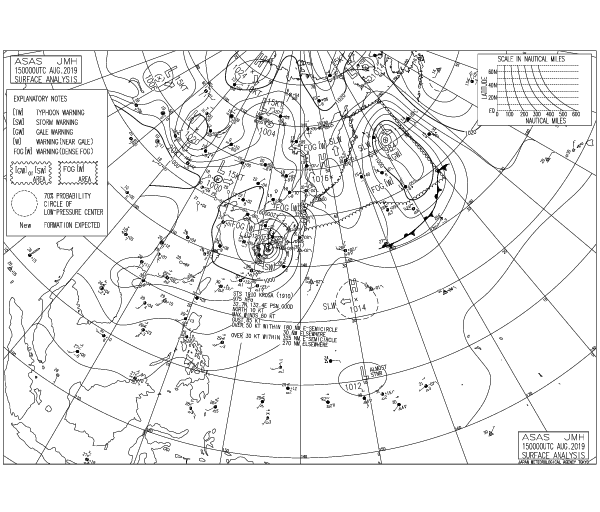
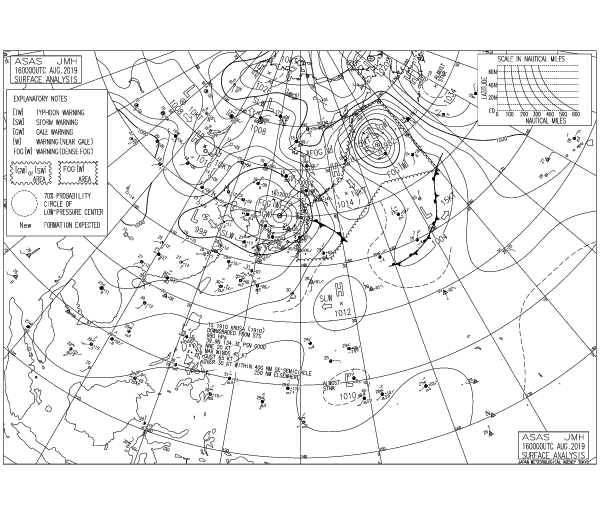
(965 hPa and 90-100 kph). On 15 August at about 03 UTC, KROSA made a landfall as a tropical storm in the Japanese
prefecture of Kochi. Its trajectory led further north across the prefectures of Ehime, Hiroshima and Shimane before
the system moved back to the ocean at 09 UTC at the same day. Over the Japanese sea, the storm weakened more and
more, but also in the north of Japan, on the east coast of Korea and partly also in Russia, there was still abundant
rainfall.
Sources: NICT and Japan Meteorological Agency
KROSA's lifetime of 246 hours was remarkable considering its only moderate intensity, as the system reached typhoon
strength only in 2.5 days. During 7.5 days, the system was classified as a tropical storm and only a few hours as
tropical depression.
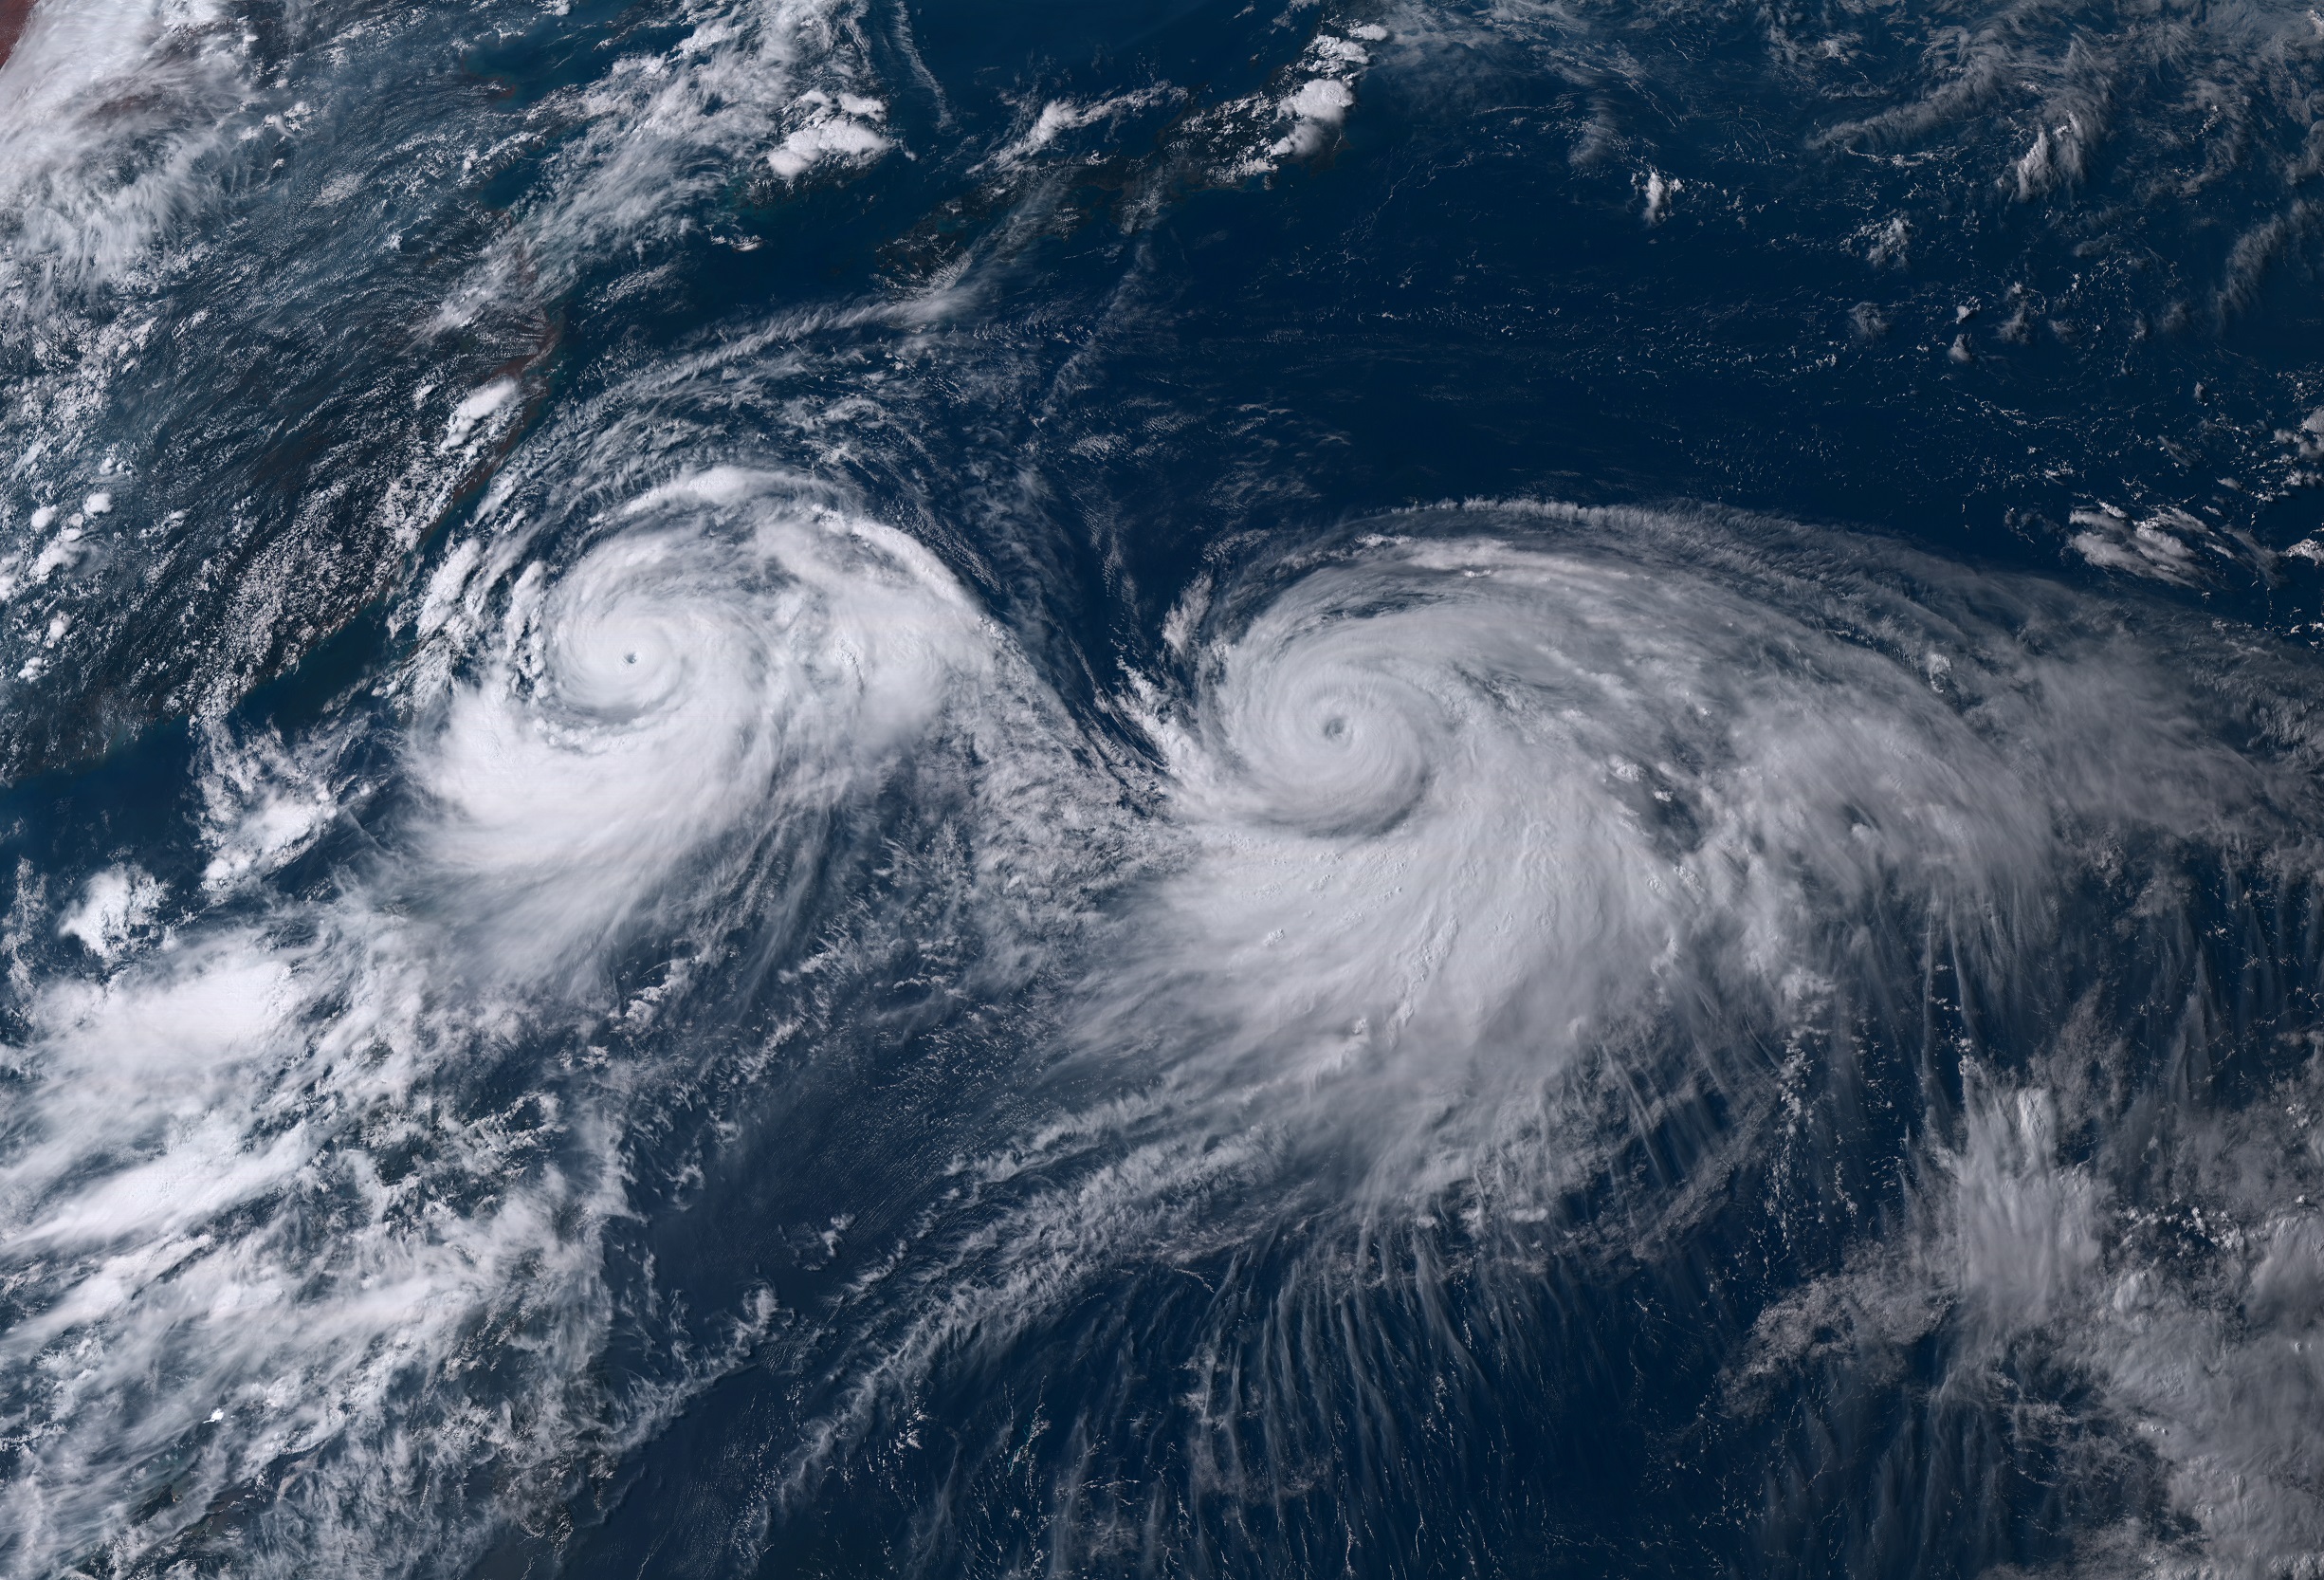
Another unusual detail was the enormous diameter of the cloudless storm eye, which was up to 80 km at times.
The satellite image at the top of the page shows the size of the eye compared to the eye of super typhoon
LEKIMA.
Observations
Since the classification of tropical storms is only based on core pressure data and mean wind speeds, this
classification gives very little information about the amount of precipitable water. As can be seen in the
satellite and radar film, tropical storm KROSA caused convective clouds and heavy precipitation over a
large area.
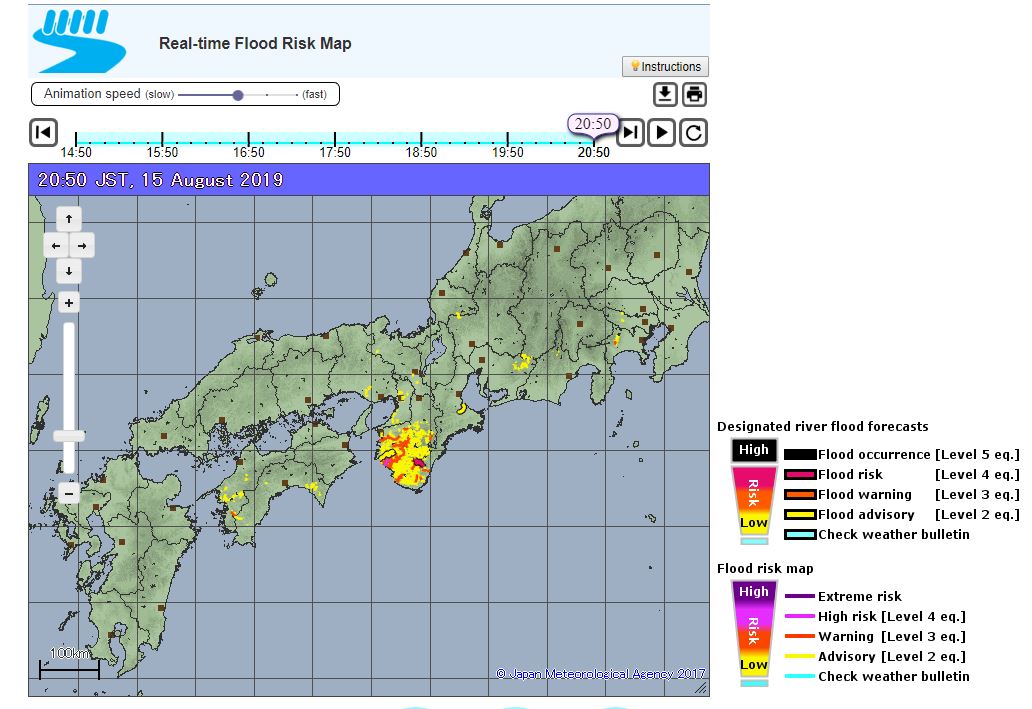
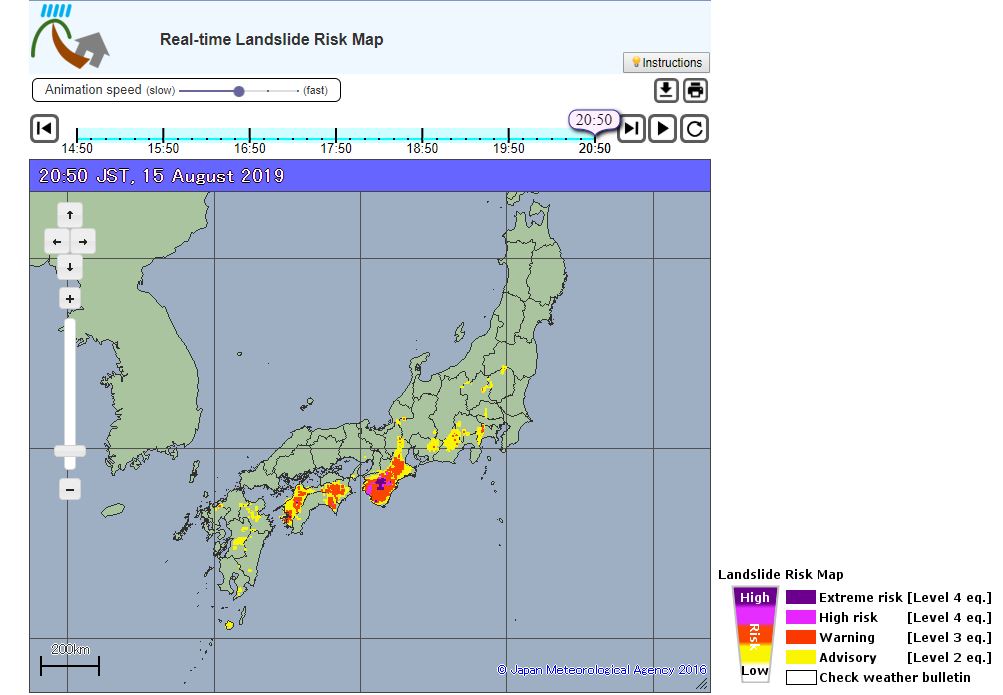
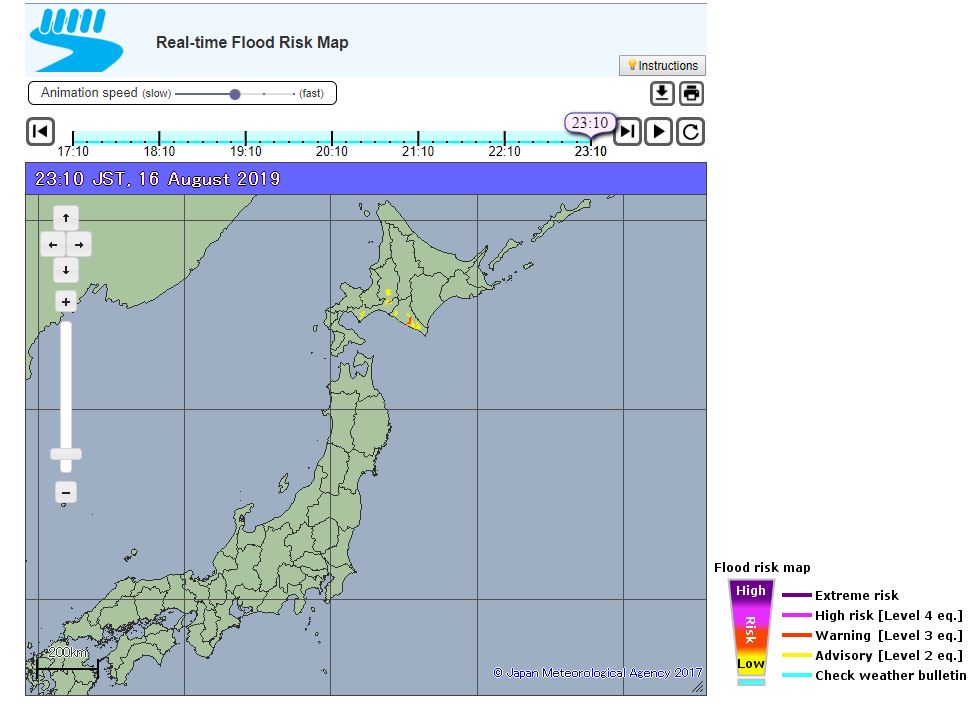
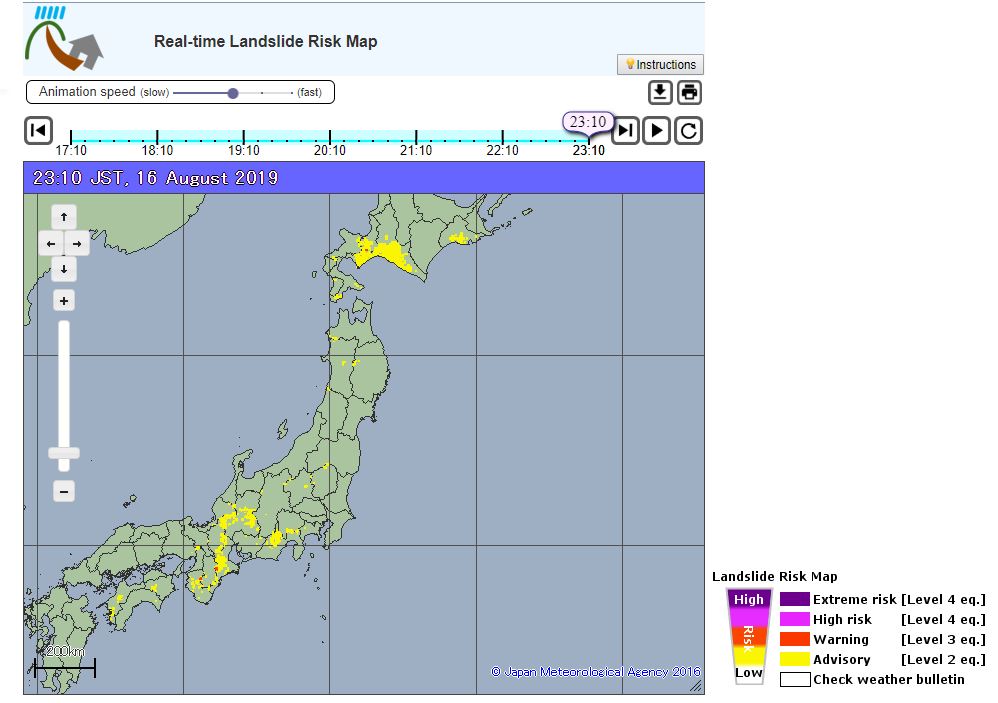
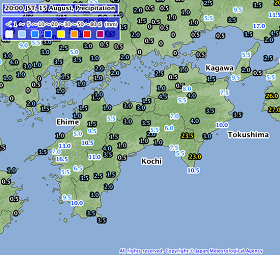
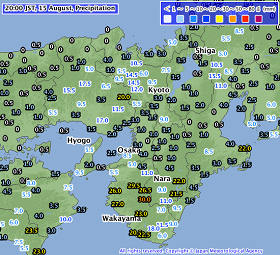
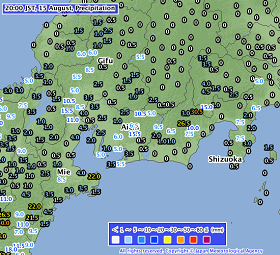
The radar film also shows how precipitation drains off on the southern hillsides of the Japanese mountains.
The rainfall amounts on the island Shikoku, in the prefectures Wakajama, Nara and Mie and south of the Hida
Mountains is much higher than in other parts of the country.
|
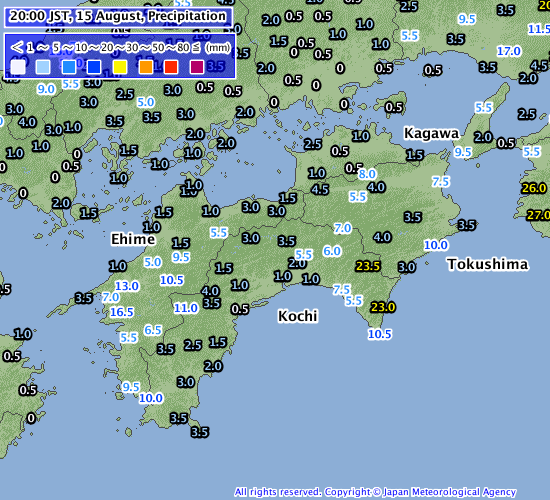
Hourly precipitation (observation) from 15 August, 11 UTC in Shikoku and the southern coast of Honshu,
Source: Japan Meteorological Agency
|
 |
 |
 |
The table below shows an overview of 24 h precipitation in the affected areas. It is worth a note that tropical
storm KROSA also caused rainfall of more than 100 mm/24h in parts of China and Russia.
| Location |
24 h Precipitation
amount in mm |
Date |
Yakusima (JP)
Ryujin (JP)
Sakihama (JP)
Hikigawa (JP)
Kawabe (JP)
Owase (Japan) (JP)
Muroto-Misaki (JP)
Pos'Et (RU)
Murotomisaki (JP)
Yanji (CN)
Karurusu (JP)
Morino (JP)
Noboribetsu (JP)
Nakakineusu (JP)
|
113.0
387.0
240.5
228.5
209.0
192.0
128.5
117.0
102.0
100.7
135.0
130.5
123.0
112.0
|
14.08.2019
15.08.2019
15.08.2019
15.08.2019
15.08.2019
15.08.2019
15.08.2019
15.08.2019
15.08.2019
15.08.2019
16.08.2019
16.08.2019
16.08.2019
16.08.2019
|
|
Data source:
Source: Japan Meteorological Agency,
Ogimet.
Text: FS
August 16, 2019
|