|
At the 31 October a tropical storm with the name Eta was formed in the Caribbean Sea under favourable conditions. A rapid intensification period was observed. At the 3 November the storm made landfall at the east coast of Nicaragua as a categorie 4 hurricane with damaging winds and extreme precipitation rates!
Hurricane Eta developed from a low-pressure system in the Caribean Sea, in the area with high sea surface temperatures above 28°C, low vertical wind shear under
15 m/s (850-200 hPa) and a large midlevel moisture above 70 %. These ingredients led to a very rapid intensification period. Eta developed in 24 hours from a tropical depression with isolated convective thunderstorms
to a major hurricane of the categorie 4 with a characteristic eye and convective spiral bands with the strongest winds around it. At the peak intensity the storm
reached a minimum pressure of 927 hPa, which was the lowest pressure for an hurricane in this season.
The hurricane made landfall at the 3 November with sustained winds of 150 mph, a strong sturm surge and intense rainfall. Mainly severe floodings caused in the sum
261 deaths in the Caribean countrys.
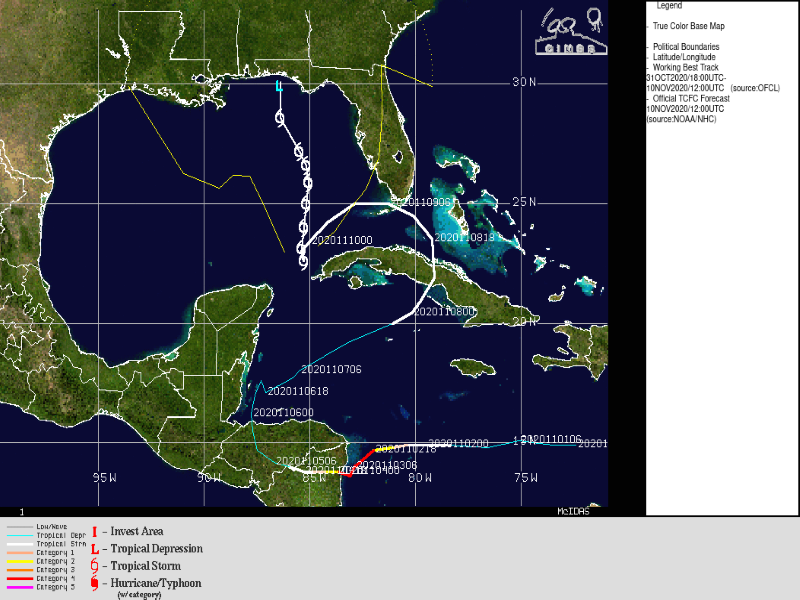
Trajectory of Hurricane Eta, source:
CIMSS
 |
|
Over land the storm decrease strongly in strength due to frictional processes and the capping of energy reservoir. The eye disappeared and the convection in the
eye wall weaken rapidly. At 5 November Eta dropped to tropical depression status. The storm maintened its low level vortex and got stronger due to a midlevel trough over the Gulf
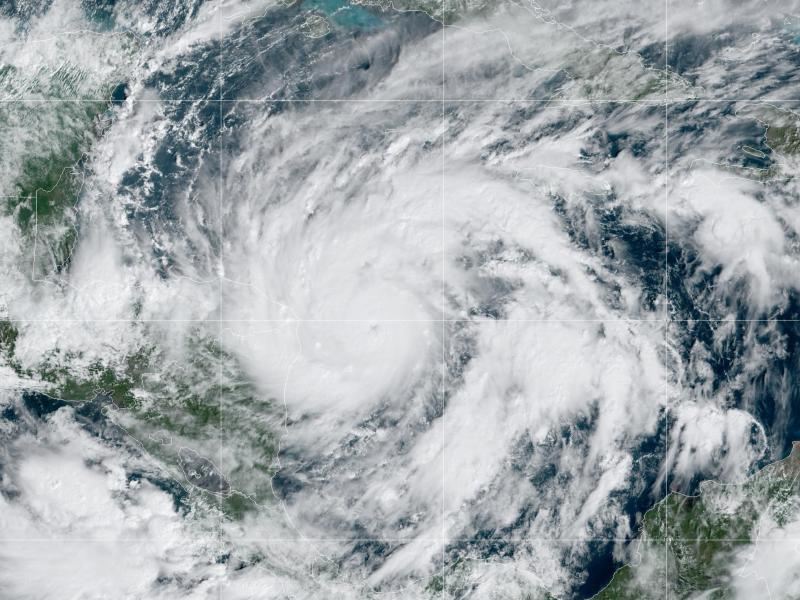
of Mexico. On the 7 November the system became better organized and reintensified in a tropical storm. But a stronger reintensification was limited because of a stronger
vertical wind shear near the coast of Cuba.
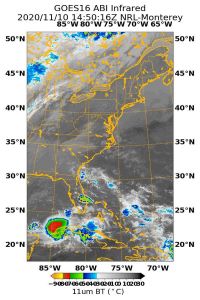
Satellite image of tropical storm Eta after reintensification on 10.11.2020 00 UTC, source:
NOAA
 |
|
Etas second landfall was in Cuba as a tropical storm. The system weakened only slightly, because it moved quickly back over water to the north towards the coast of
Florida. The storm intensified shortly even dry air was advected in the center and values of wind shear increased to the north. Eta made on 9 November at 4 UTC his third
landfall as a tropical storm with similar strength as in Cuba, before the strom turned to the southwest due to a strong deep layer ridge across the Gulf of Mexico.
|
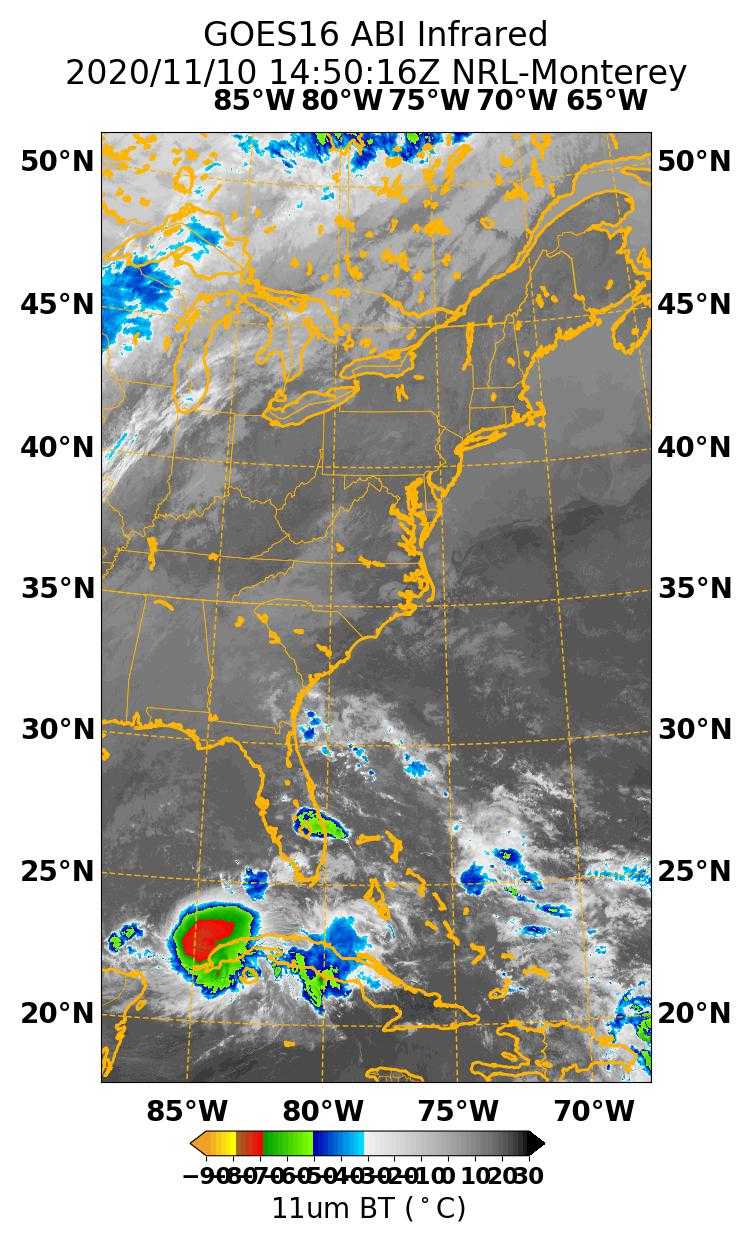
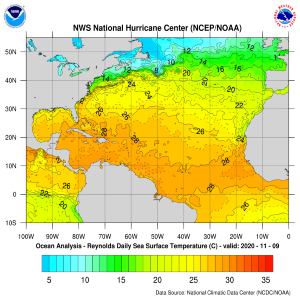
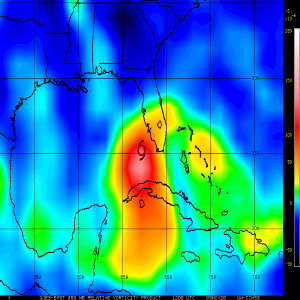
Radar image after reintensification 10.11.2020 14:50 Z (left), sea surface temperature 09.11.2020 (middle) and relative vorticity 850 hPa 10.11.2020 (right) source:
NOAA
|
 |
 |
 |
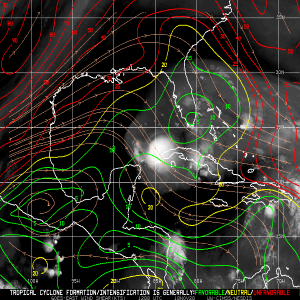
The storm is now located for the west coast of Cuba and is nearly stationary. That means the highest danger for west Cuba comes from intense rainfall, which will
cause severe floodings in the western part of the island. In the next day Eta will move northward under decreasing intensity and reach northwestern Florida at Sunday as a
tropical low pressure system.
|
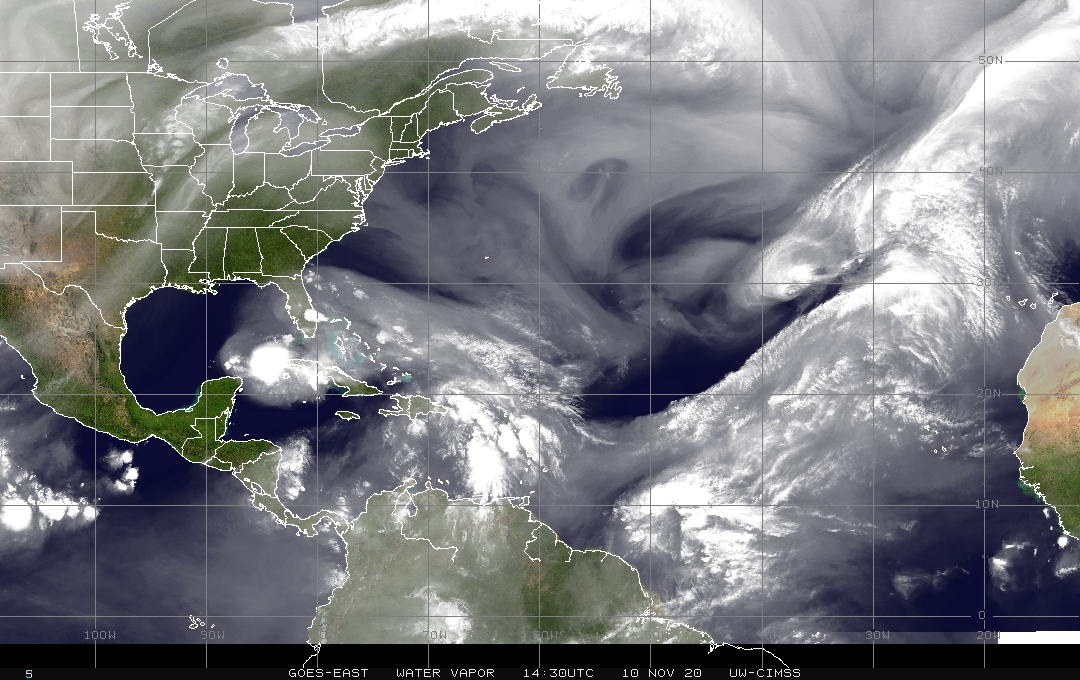
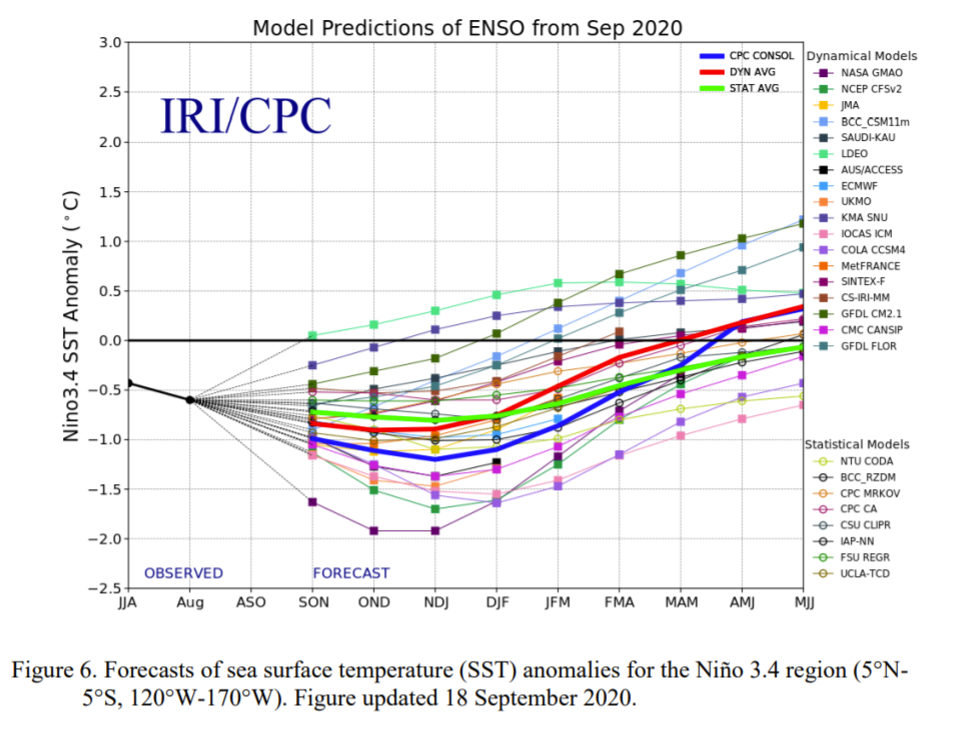
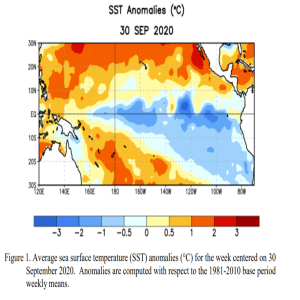
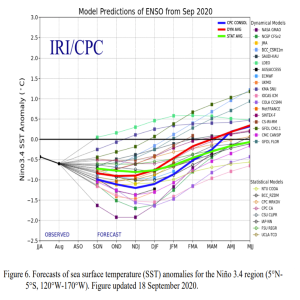
Deep layer wind shear 10.11.2020, SST anomalies for the week of 30 September and ENSO Prediction source:
NOAA
|
 |
 |
 |
The Atlantic hurricane season has now generated 103 named storms. 2020 is up to the 10th November identified as the 4th most Atlantic named storm days since 1990.
What is the reason for the high frequency in the Atlantic basin?
The first indicator is the climatological La Nina phenomen. If there is a La Nina event like in 2020, the Atlantic ocean will
produce in the mean much more tropical cyclones due to favourable environmental conditions like lower vertical wind shear and warmer sea surface temperature, especially
in the western part. Another important factor ist the atlantic multidecadal oscillation (AMO). The AMO is a coherent mode of natural variability in the Atlantic
Ocean with a period of 60-80 years, which influence the sea surface temperature. While a positive phase like in 2020 more tropical storms will develop. The combination of a La Nina event and a positive
AMO will increase the probability for a very active hurricane season in the Atlantic basin strongly. This is the case in 2020!
| Location |
24h Precipitation in mm |
Date |
Tela(HN)
Puerto Barrios(BL)
La Ceiba(HN)
|
354.8
296.4
260.5
|
05.11.2020
03.11.2020
05.11.2020
|
|
| Location |
3 day Precipitation in mm |
Date |
Tela(HN)
La Ceiba(HN)
Puerto Barrios(BL)
|
622.0
466.8
431.0
|
06.11.2020
06.11.2020
06.11.2020
|
|
Text: NB
November 10, 2020
|