|
Storm low BRIGITTE was a Shapiro-Keyser cyclone and caused wind speeds of up to 181 km/h (Switzerland). In addition, the cyclone caused
torrential precipitation, especially along the Alps. In 24 hours, more than 250 mm occurred in some regions of the Alps, especially in Switzerland.
Weather Situation
High NEPOMUK initially ensured calm late summer weather in Europe. BRIGITTE formed at the back of a trough on the Atlantic Ocean and intensified with the support
of a jet stream and its pronounced positive divergence field. Brigitte moved across the Bay of Biscay and remained almost stationary over the English Channel on
October 2. Not until the course of the day on October 3 did the low pressure system shift over France to the northeast as far as the North Sea, where it finally
weakened slowly.
|
850 hPa equivalentpot. Temperature, October 01-04, 2020:
Wetter3
|
 |
 |
 |
 |
|
300 hPa Wind and Divergence, October 01-04, 2020:
Wetter3
|
 |
 |
 |
 |
Development and other features
BRIGITTE developed on 1 October from an initial wave disturbance at the back of a trough over the Atlantic Ocean. The wave disturbance came early
into the area of influence of a left jet exit, so that it quickly intensified to a storm low. BRIGITTE had a core pressure of about 1010 hPa on Thursday morning,
its pressure dropped to about 980 hPa by night. At that time, the storm low was over the Bay of Biscay. It continued to intensify, but slowed its rate of displacement
until it remained almost stationary over the Channel on October 2. As BRIGITTE remained in positive divergence, its pressure dropped to 979 hPa by noon. Wind speeds
reached around 80 km/h on the ground in France and Spain and over 120 km/h in exposed locations. BRIGITTE formed another marginal low on its eastern flank over
southwestern Germany until the evening. Like BRIGITTE, this was in the area of influence of a jet stream in the area of positive divergence.
In the night of Saturday October 3rd, BRIGITTE begins to shift more and more and moves with its core over the center of France. The trough on whose front is BRIGITTE
and the new marginal low is also beginning to drain. Her pressure begins to rise as the jet stream and its influence also weakens. While BRIGITTE shifts across the
North Sea to Great Britain, again intensifying slightly, the marginal low pressure area shifts across Southern Germany to Eastern Europe. Wind speeds near the ground
are weakening to around 75 km/h in France, Germany and the BeNeLux countries.
|
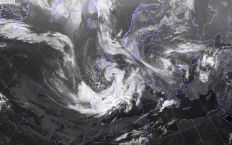
Satellite images (VIS and IR), October 01, Source:
Wokingham
|
 |
 |
 |
 |
|
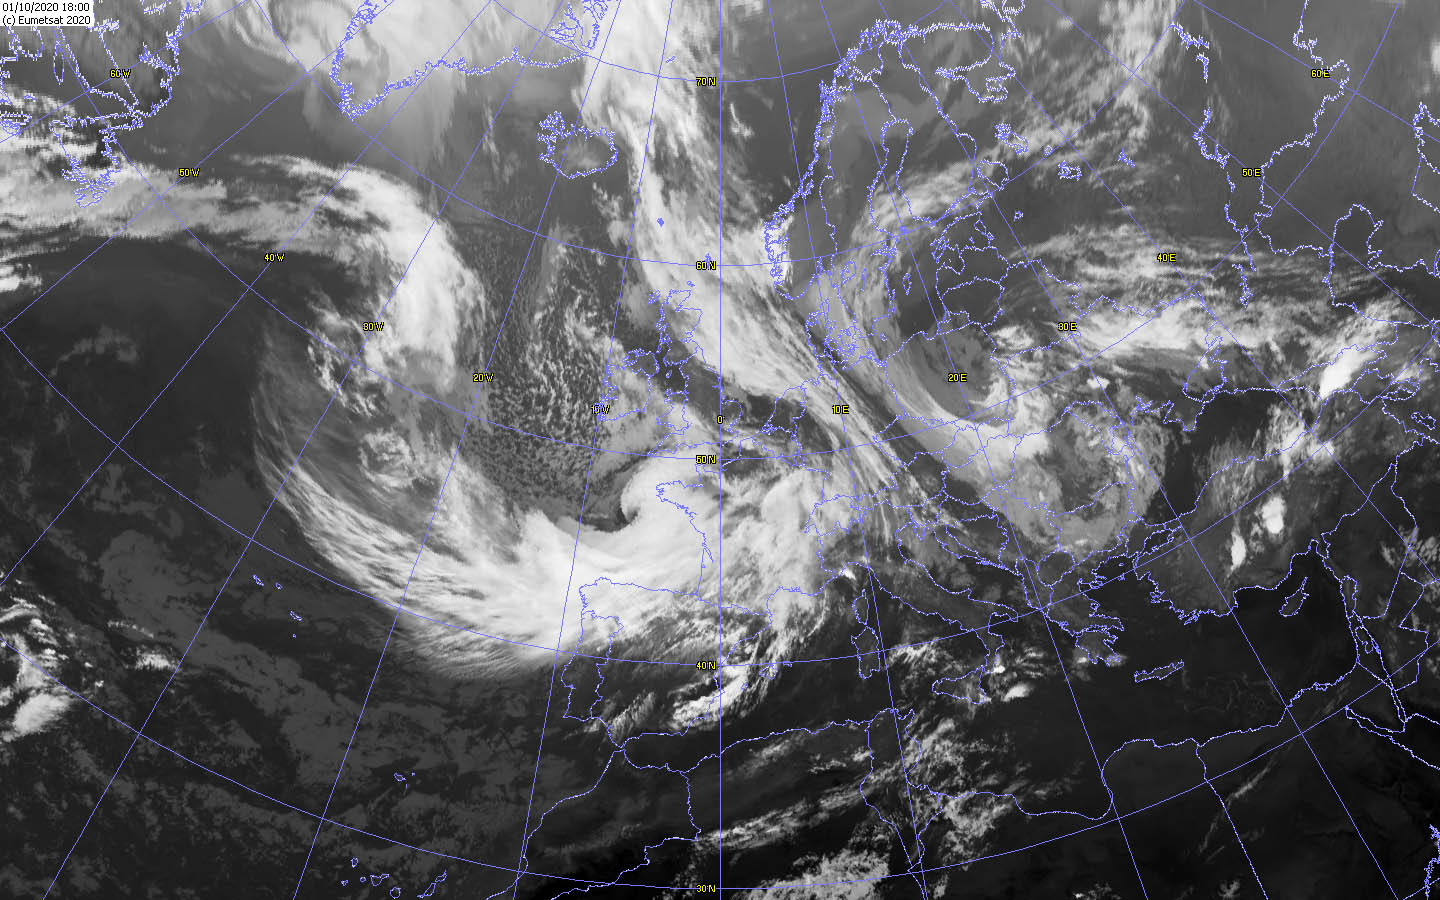
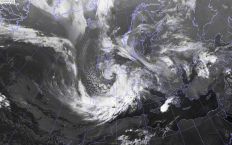
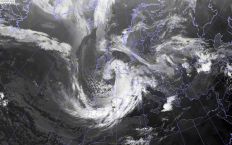
Satellite images (IR), October 01-02, Source:
Wokingham
|
 |
 |
 |
 |
|
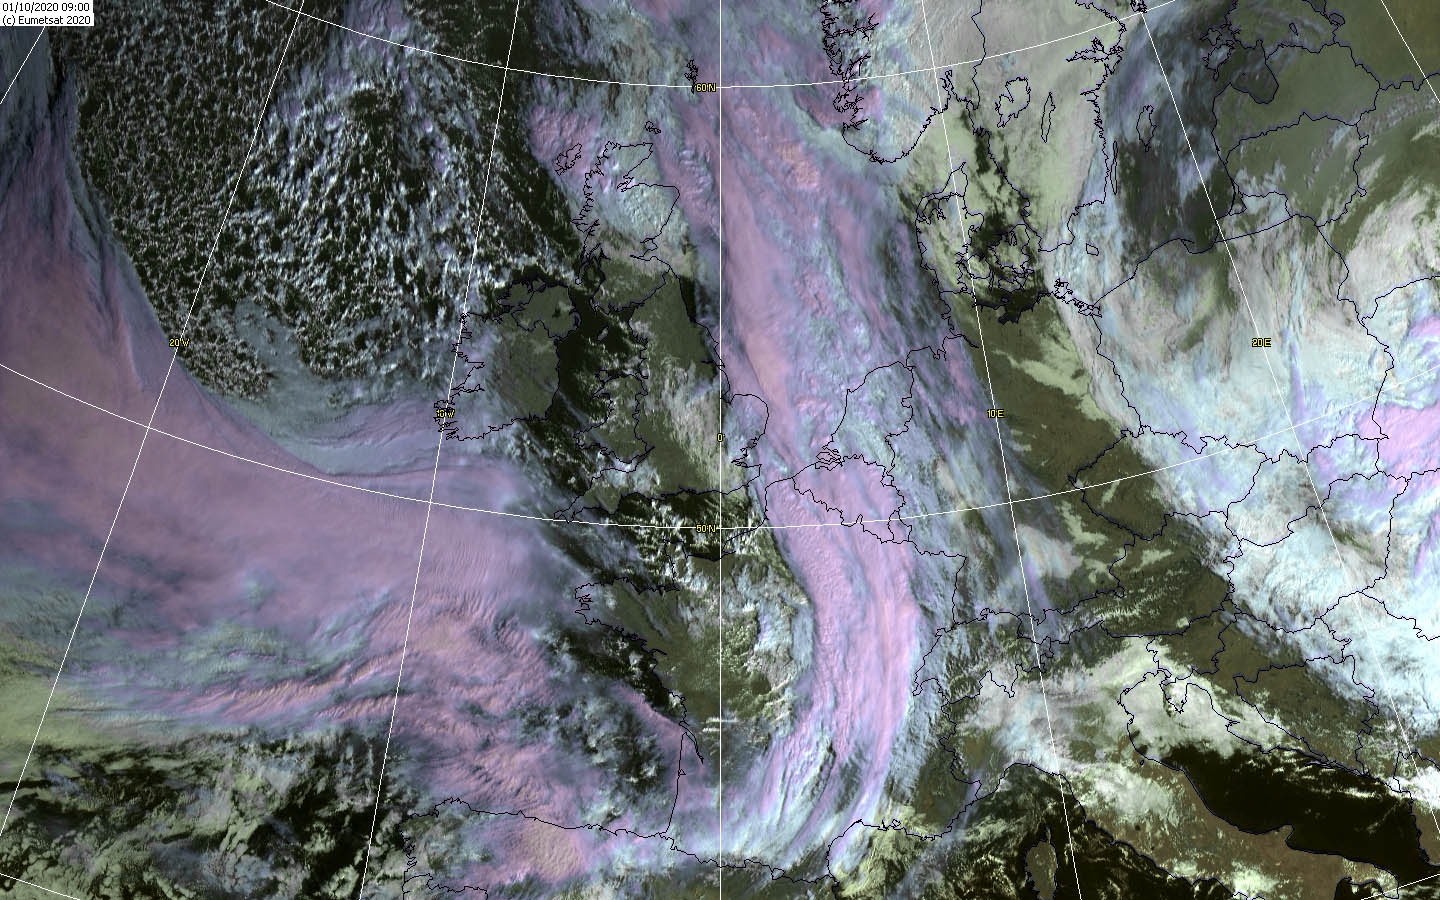
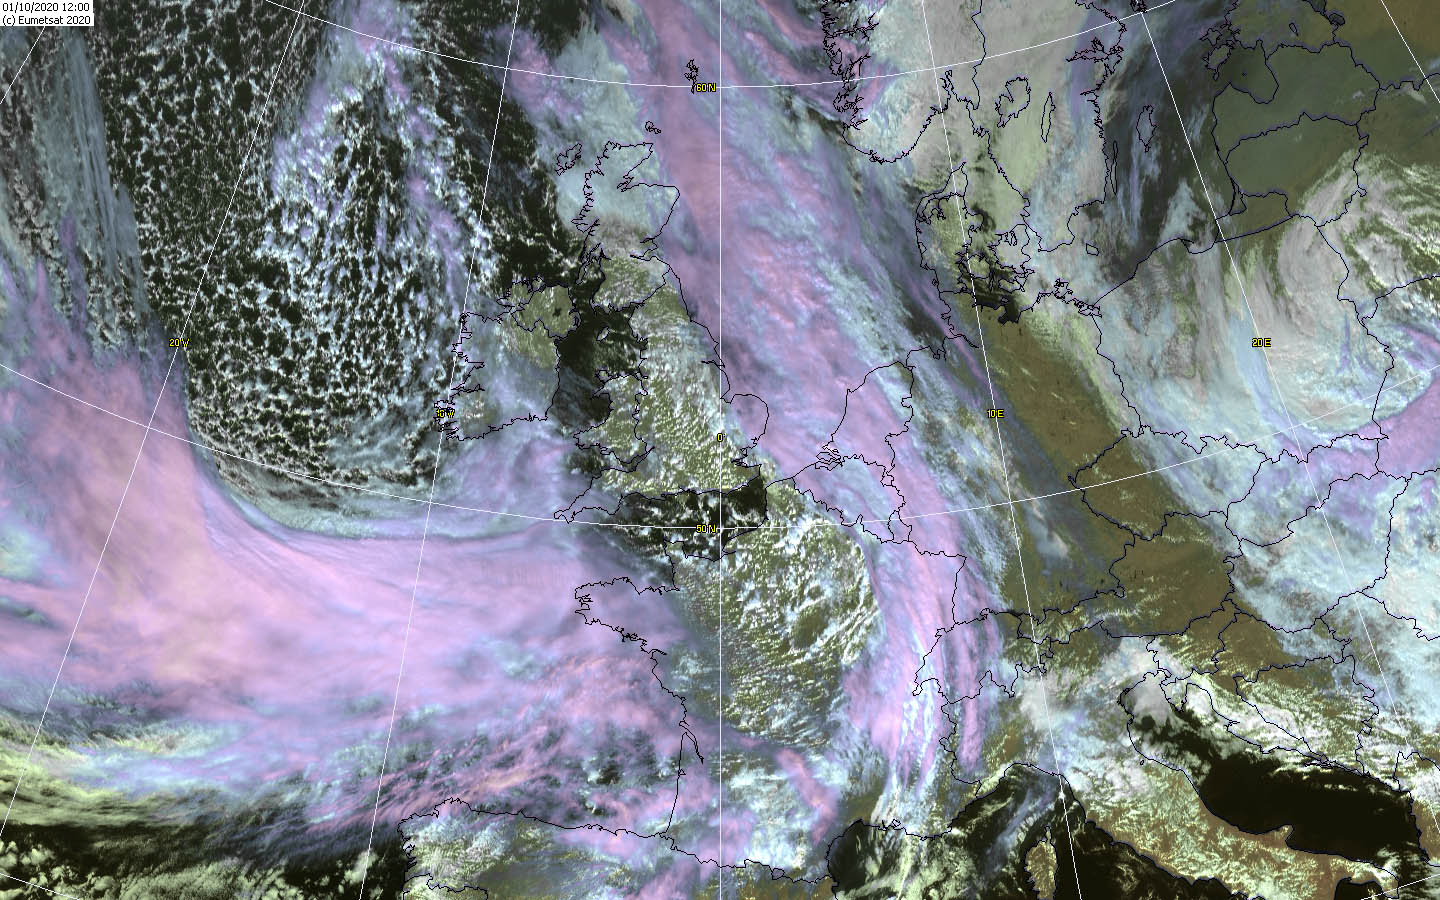
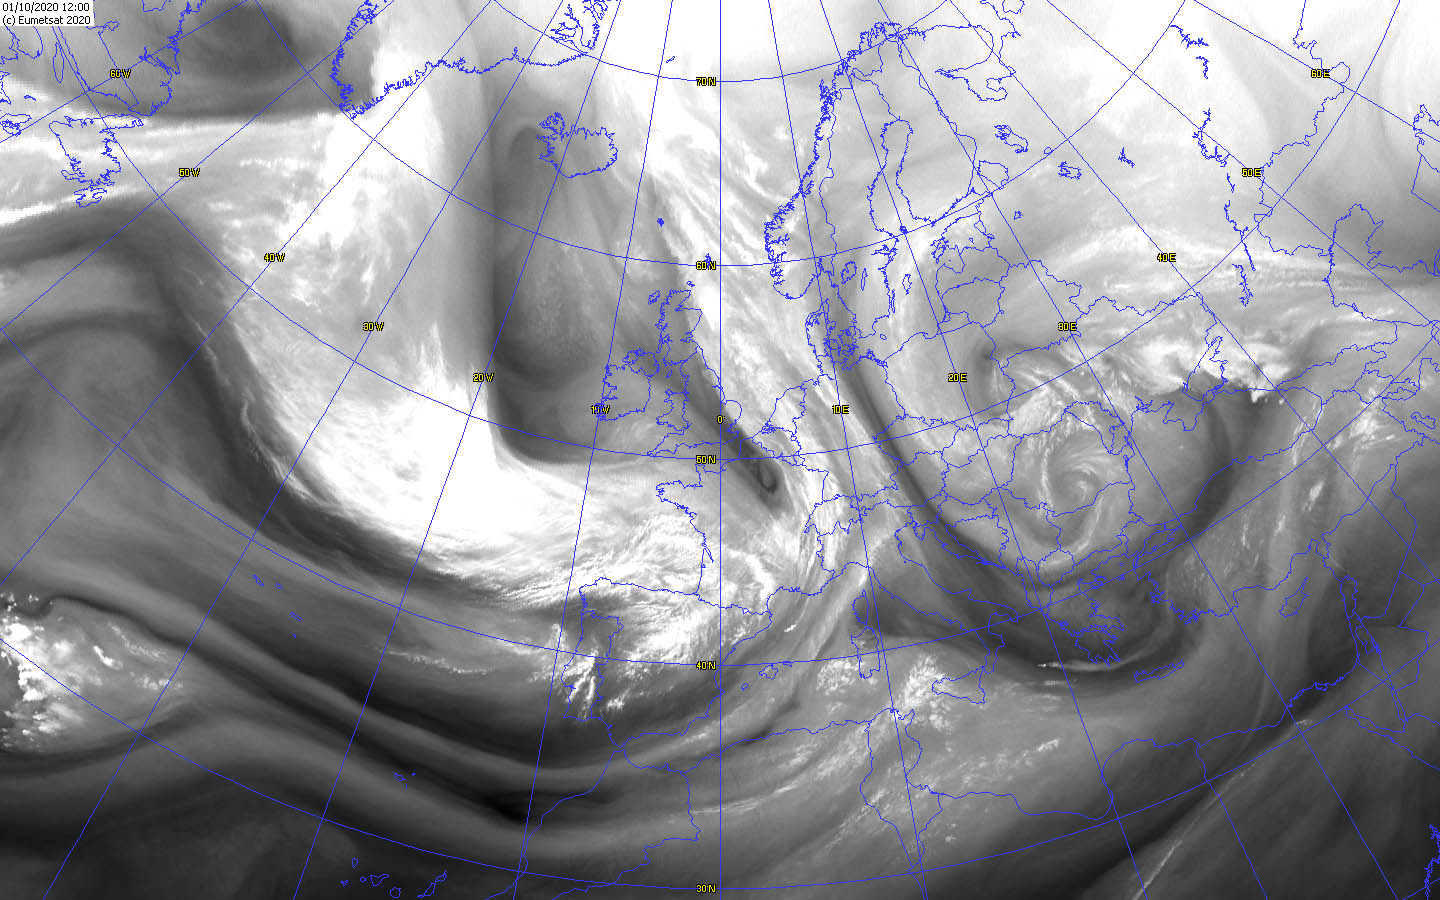
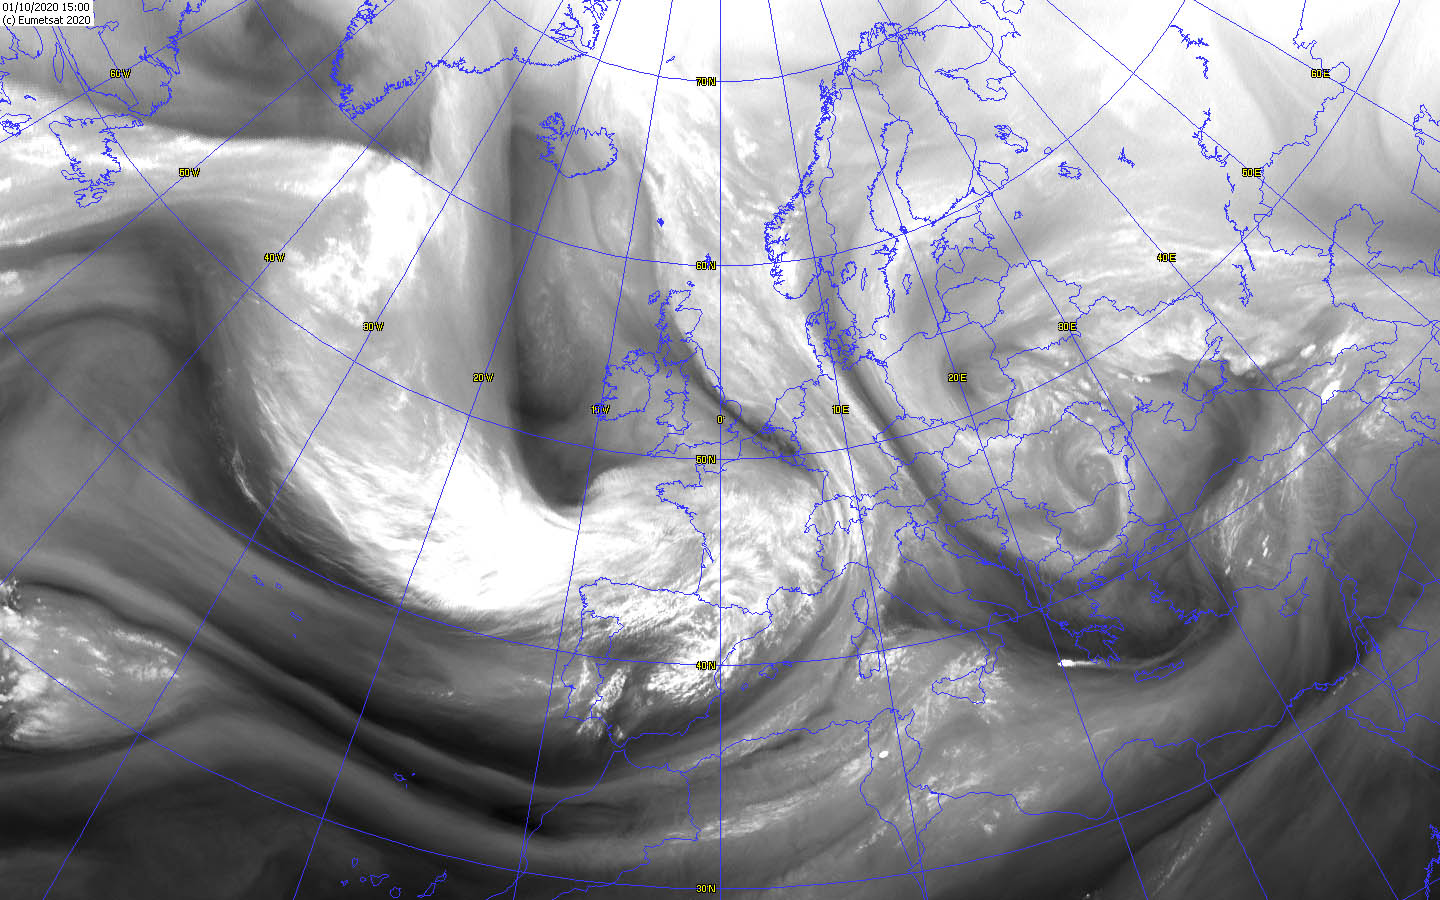
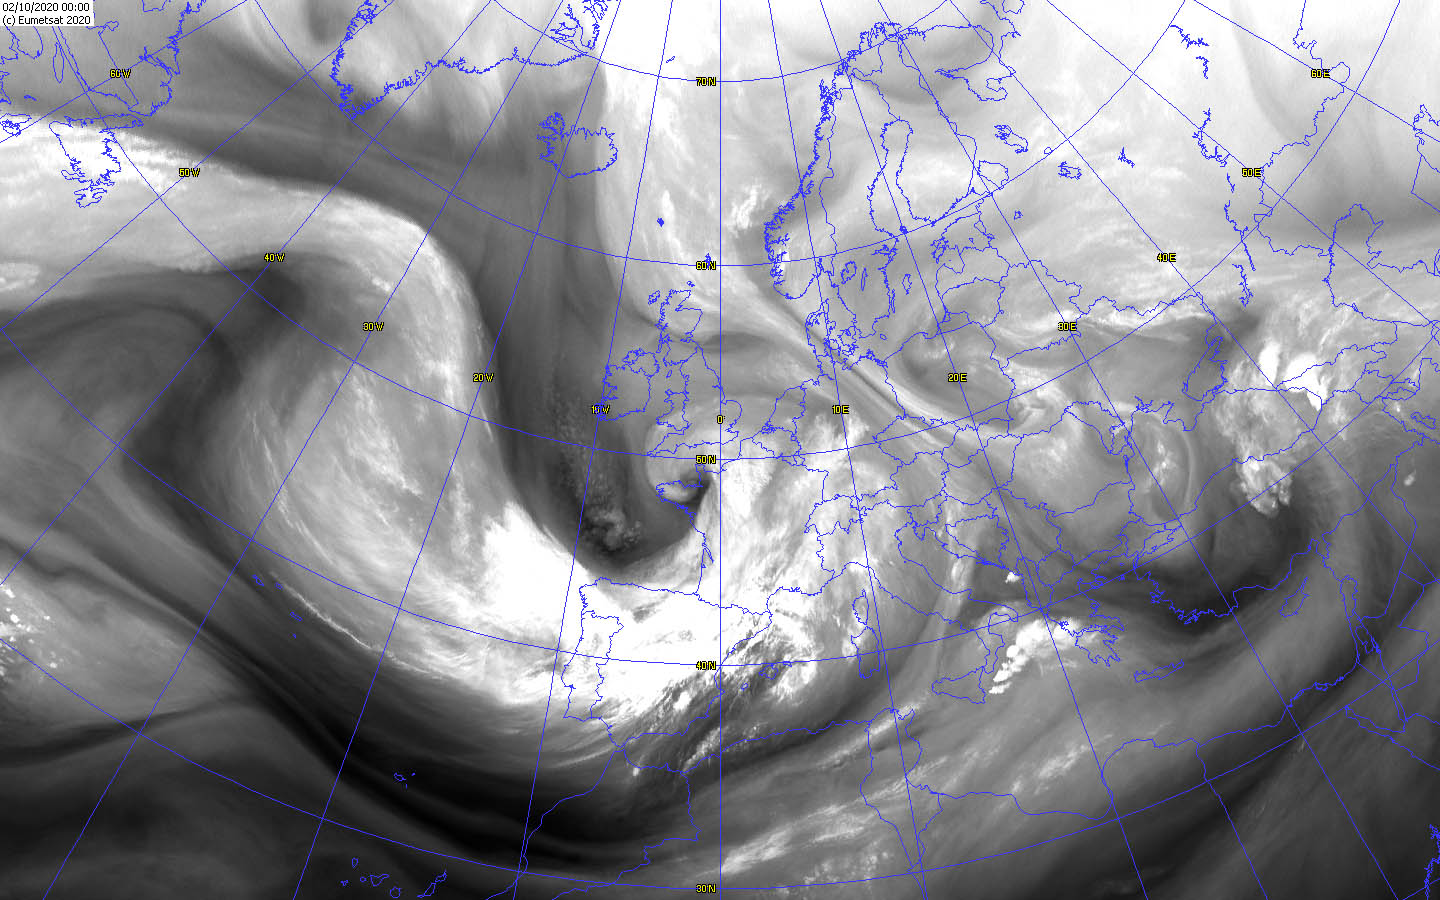
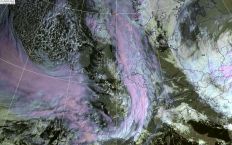
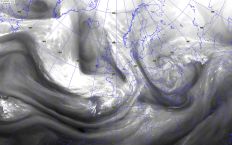
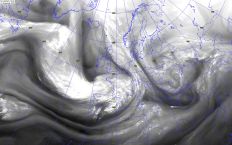
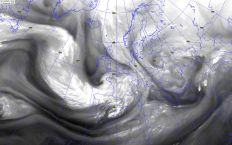
Satellite images (WV), October 01, Source:
Wokingham
|
 |
 |
 |
 |
|
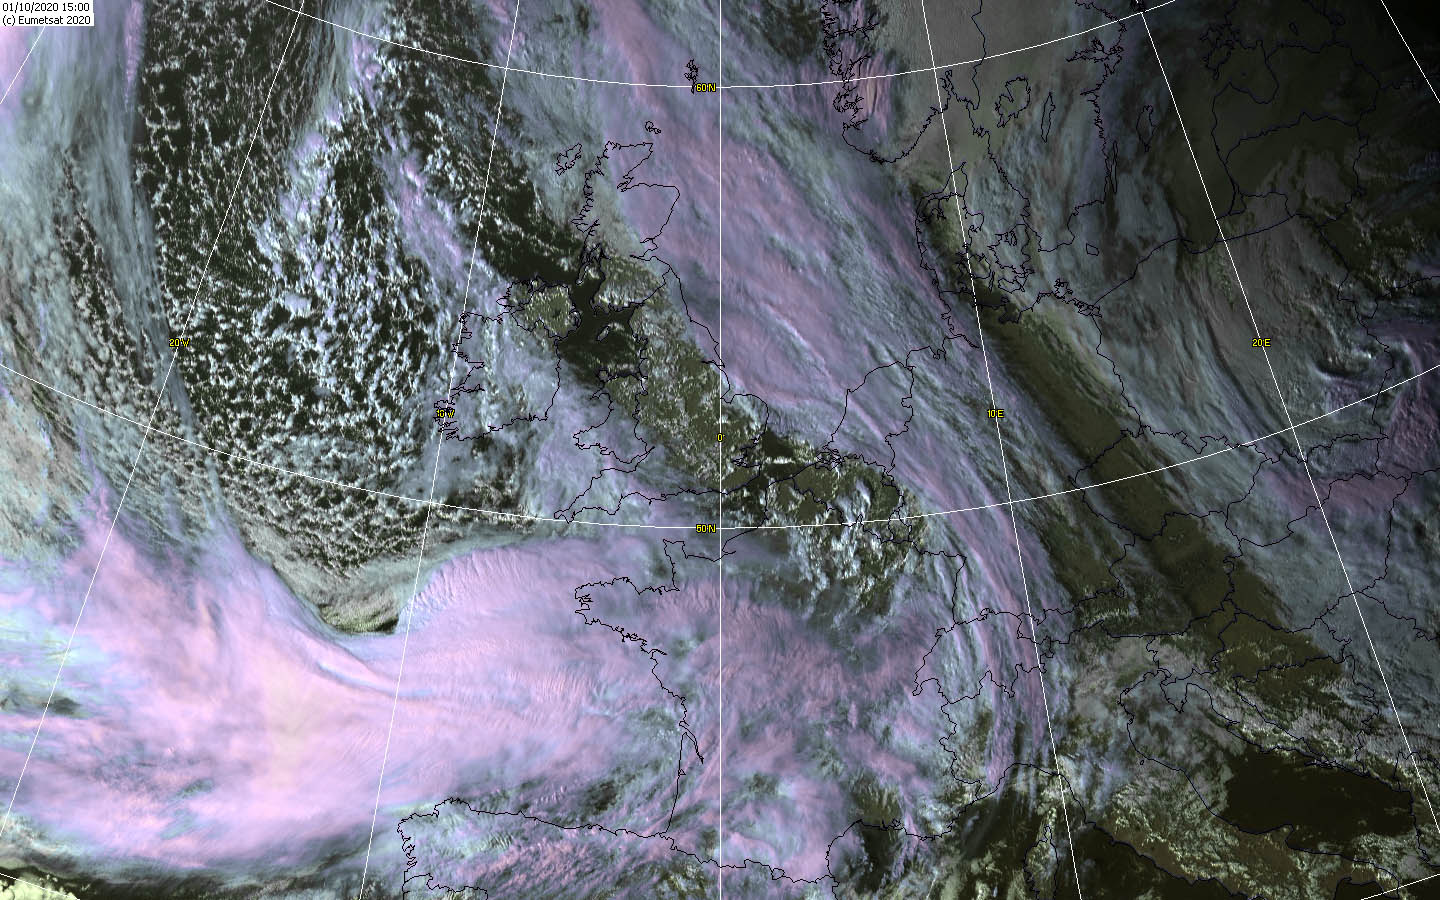
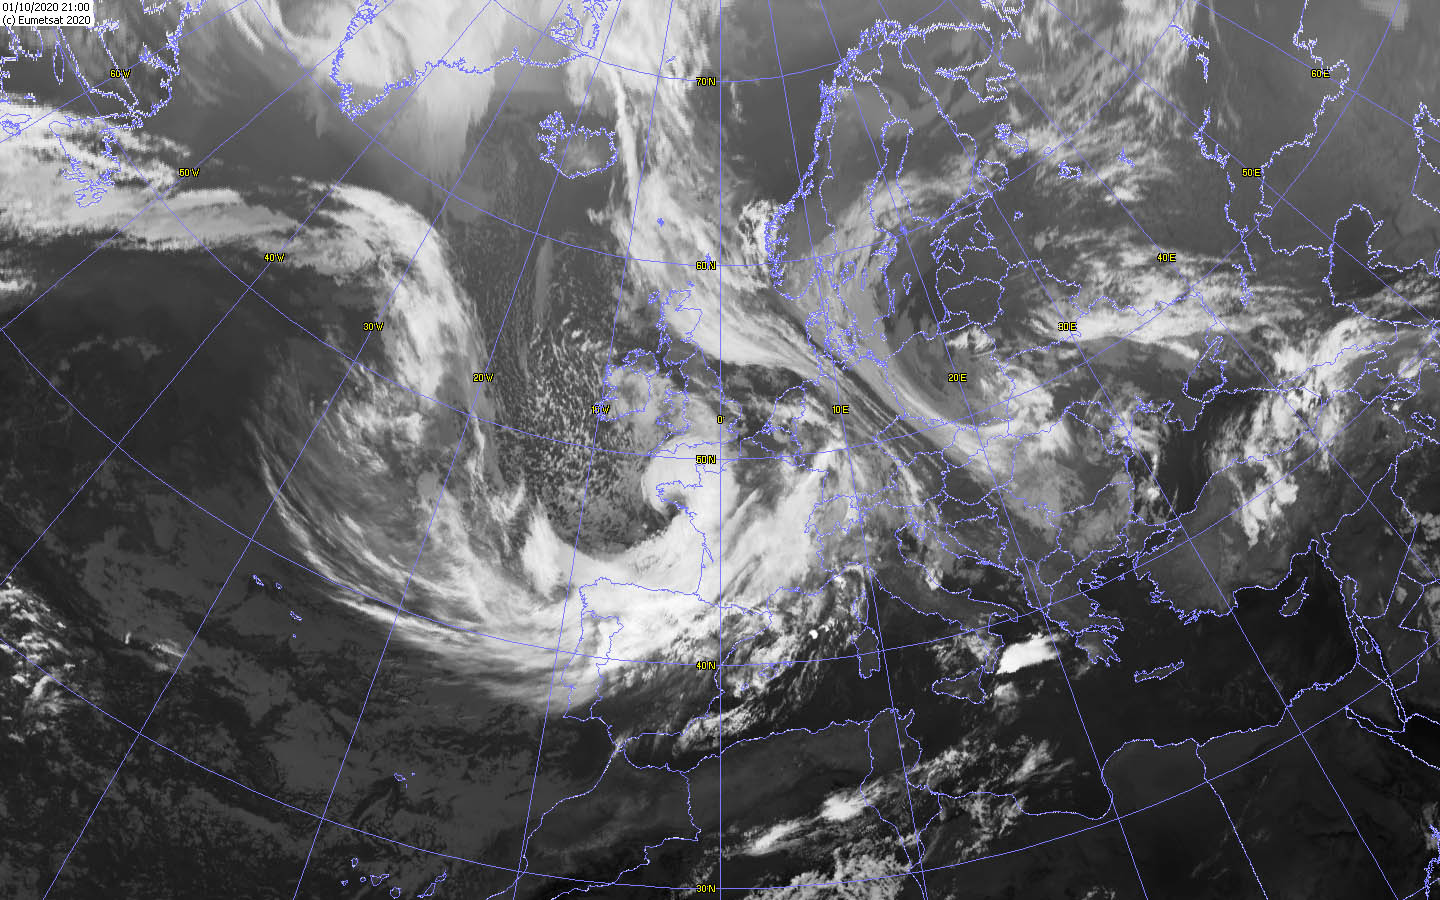
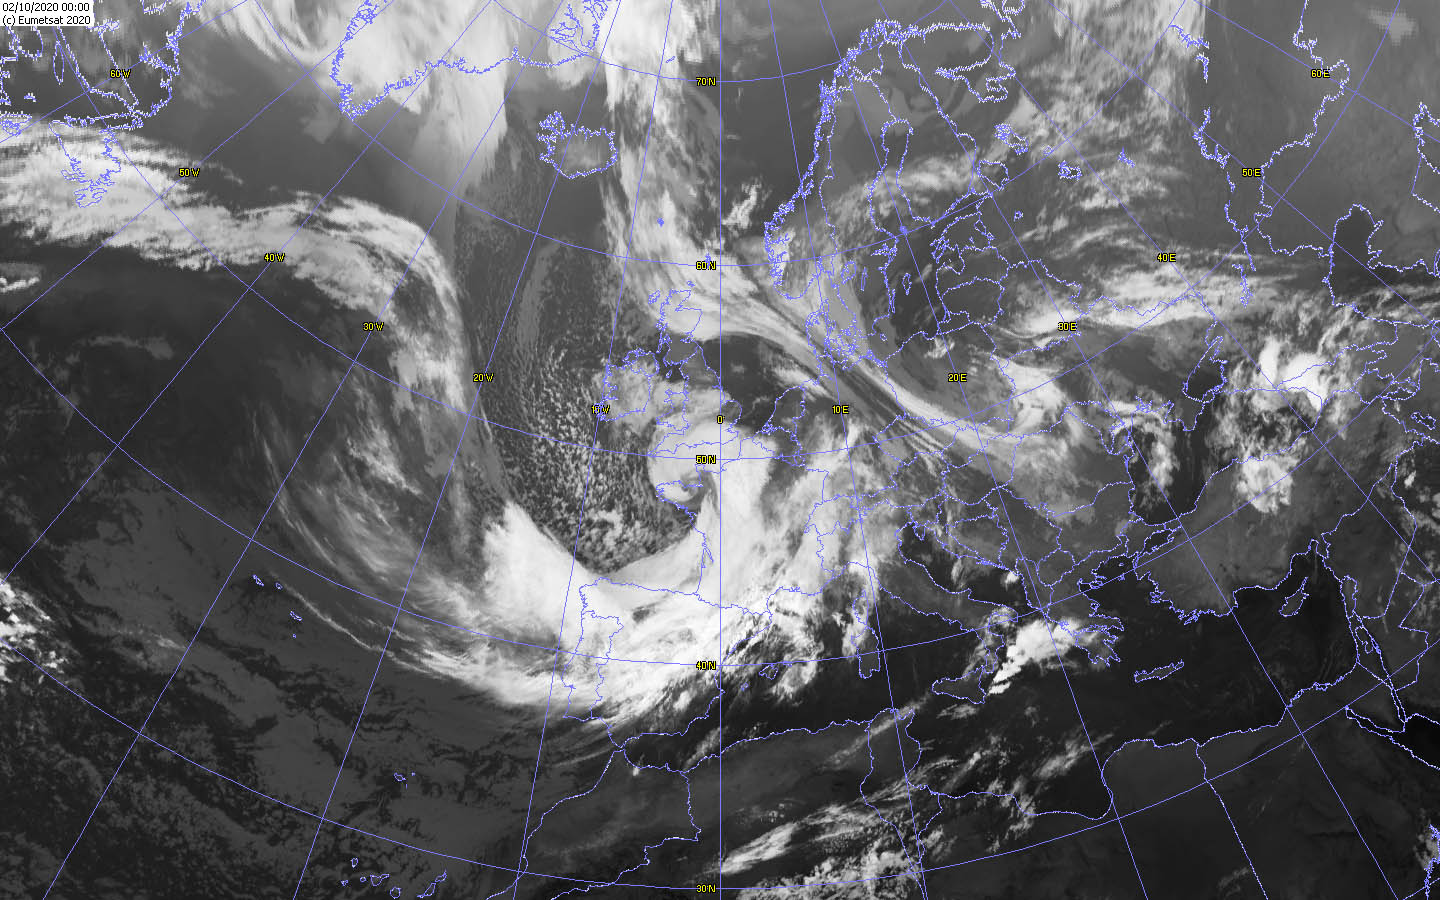
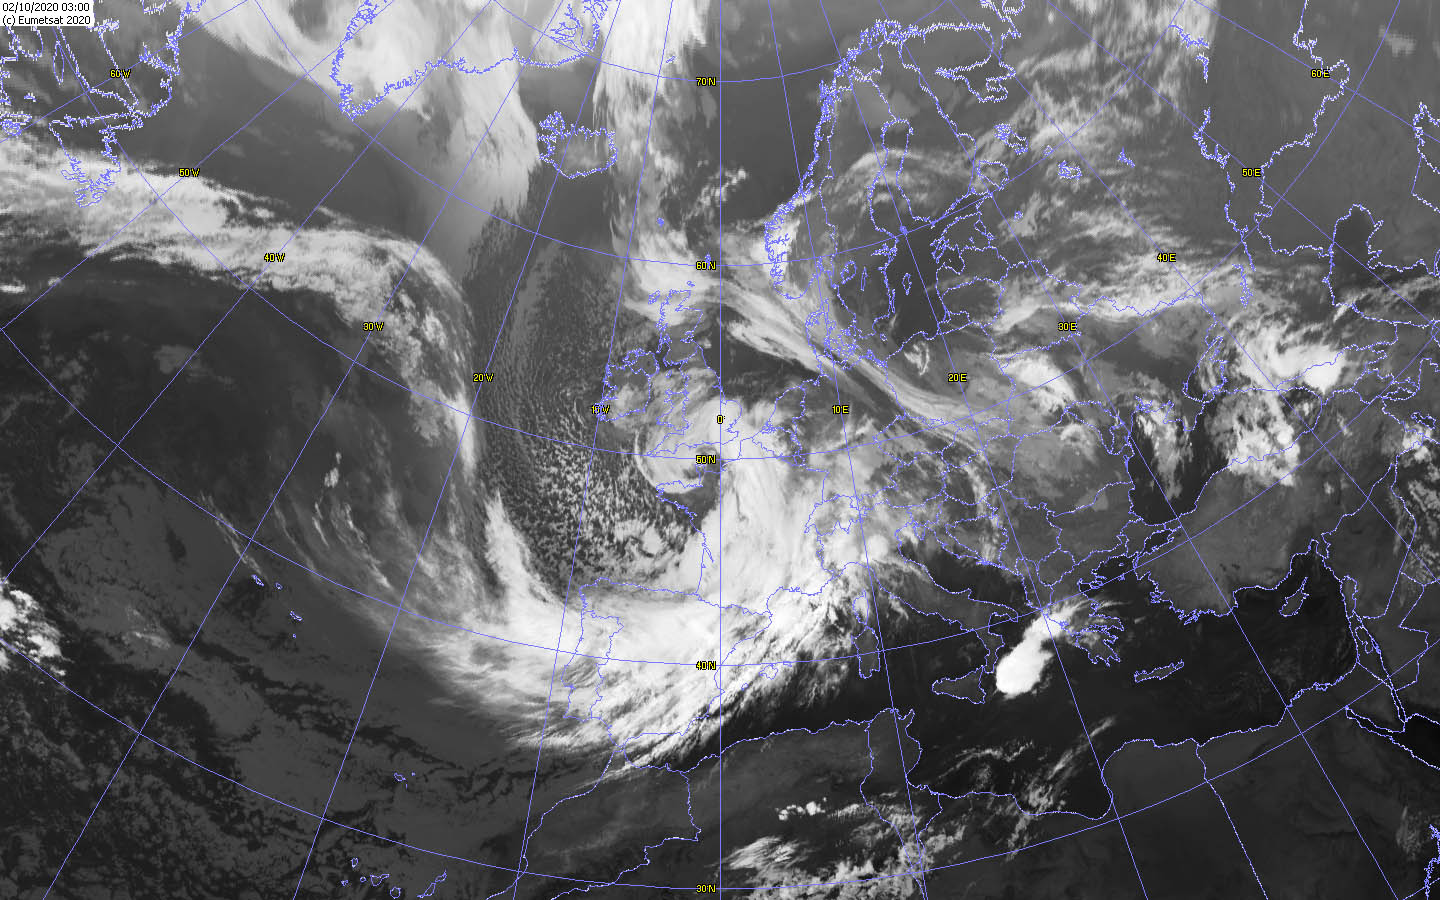
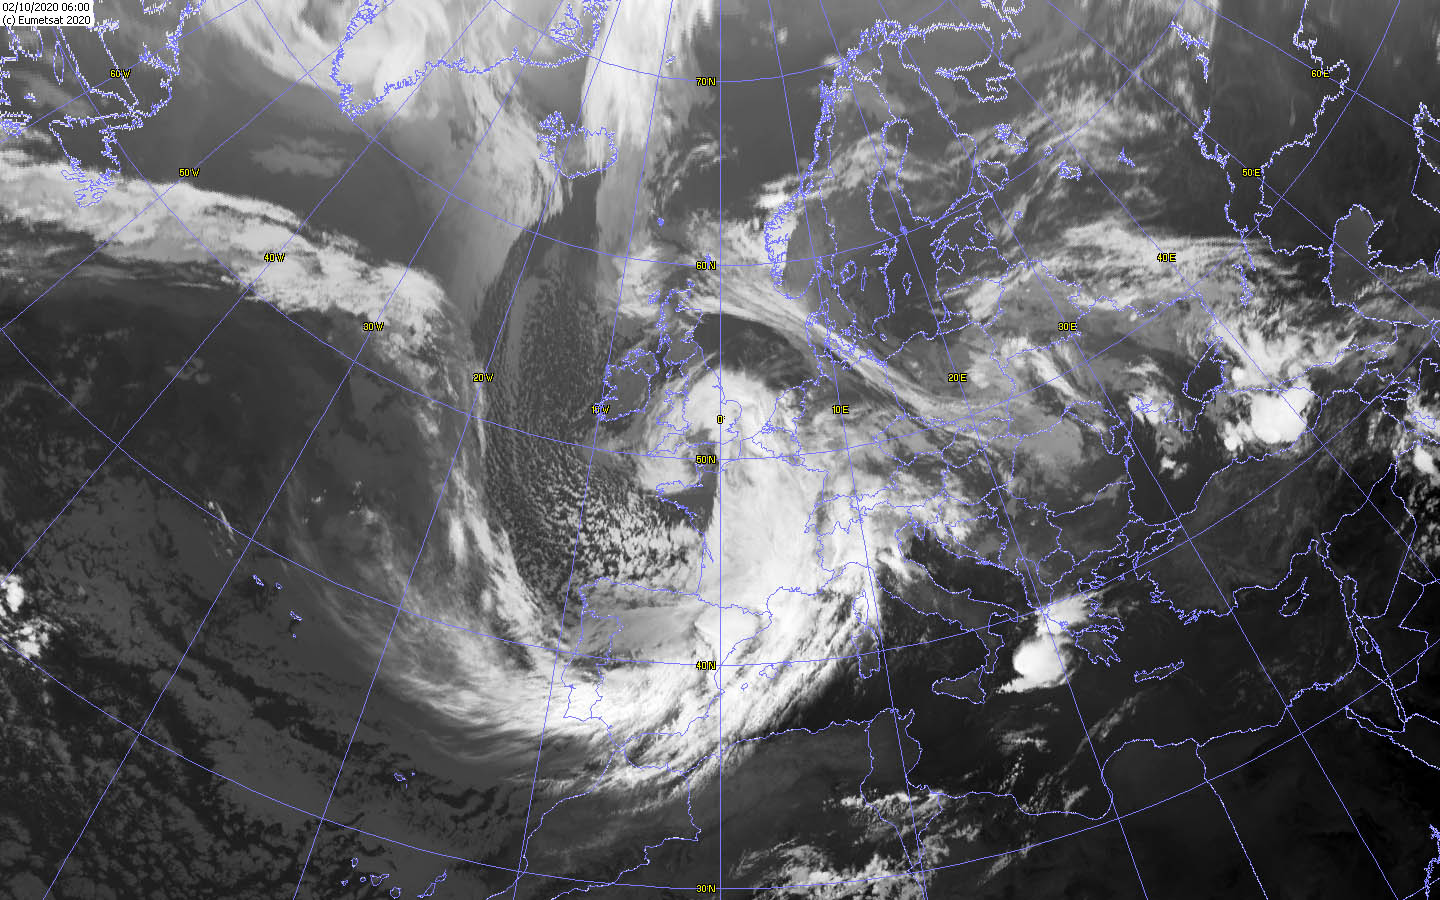
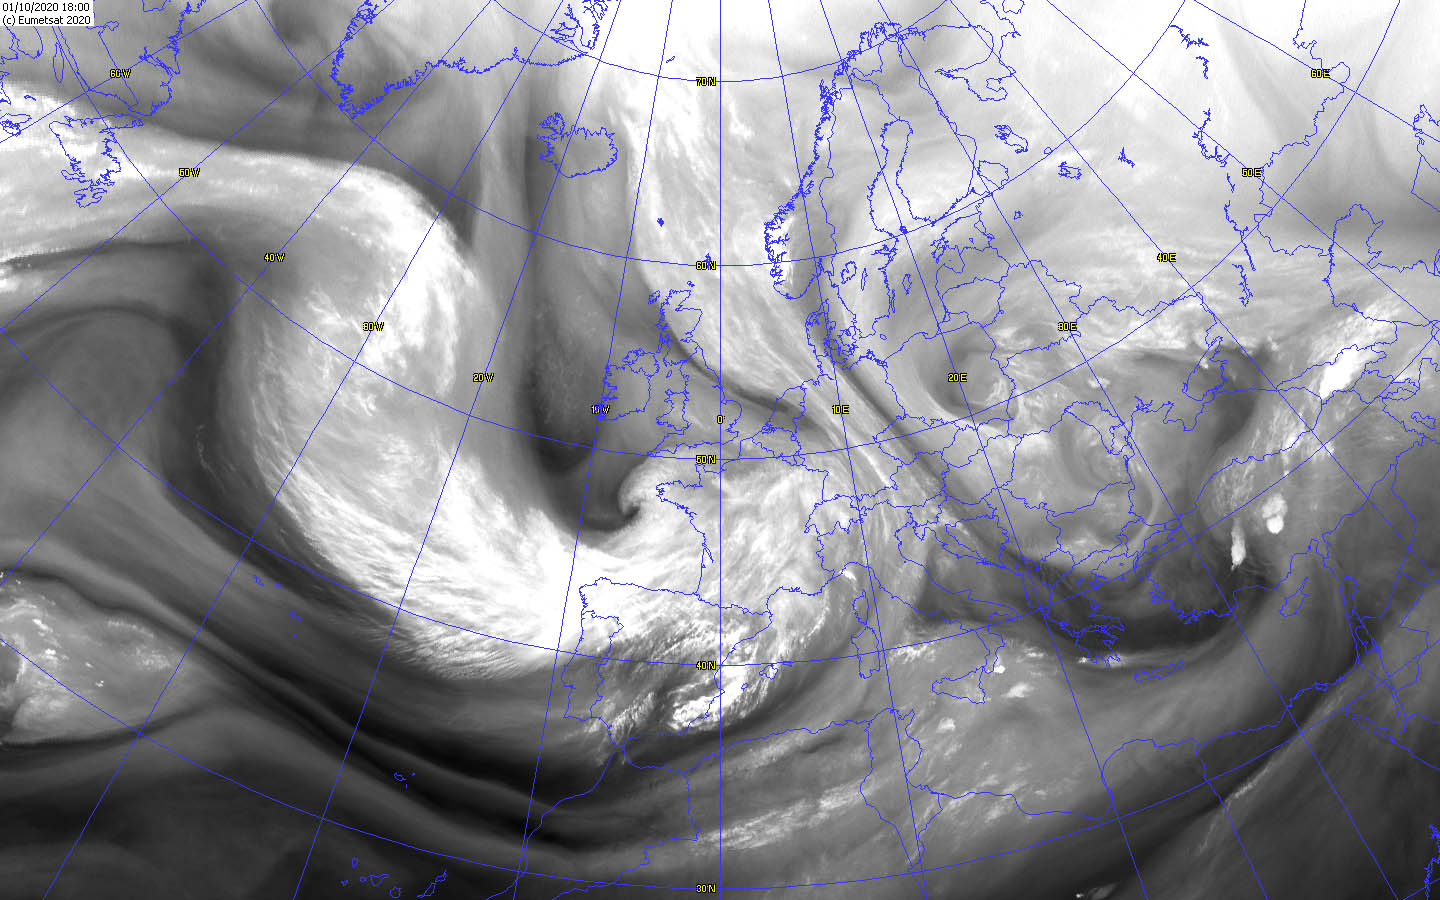
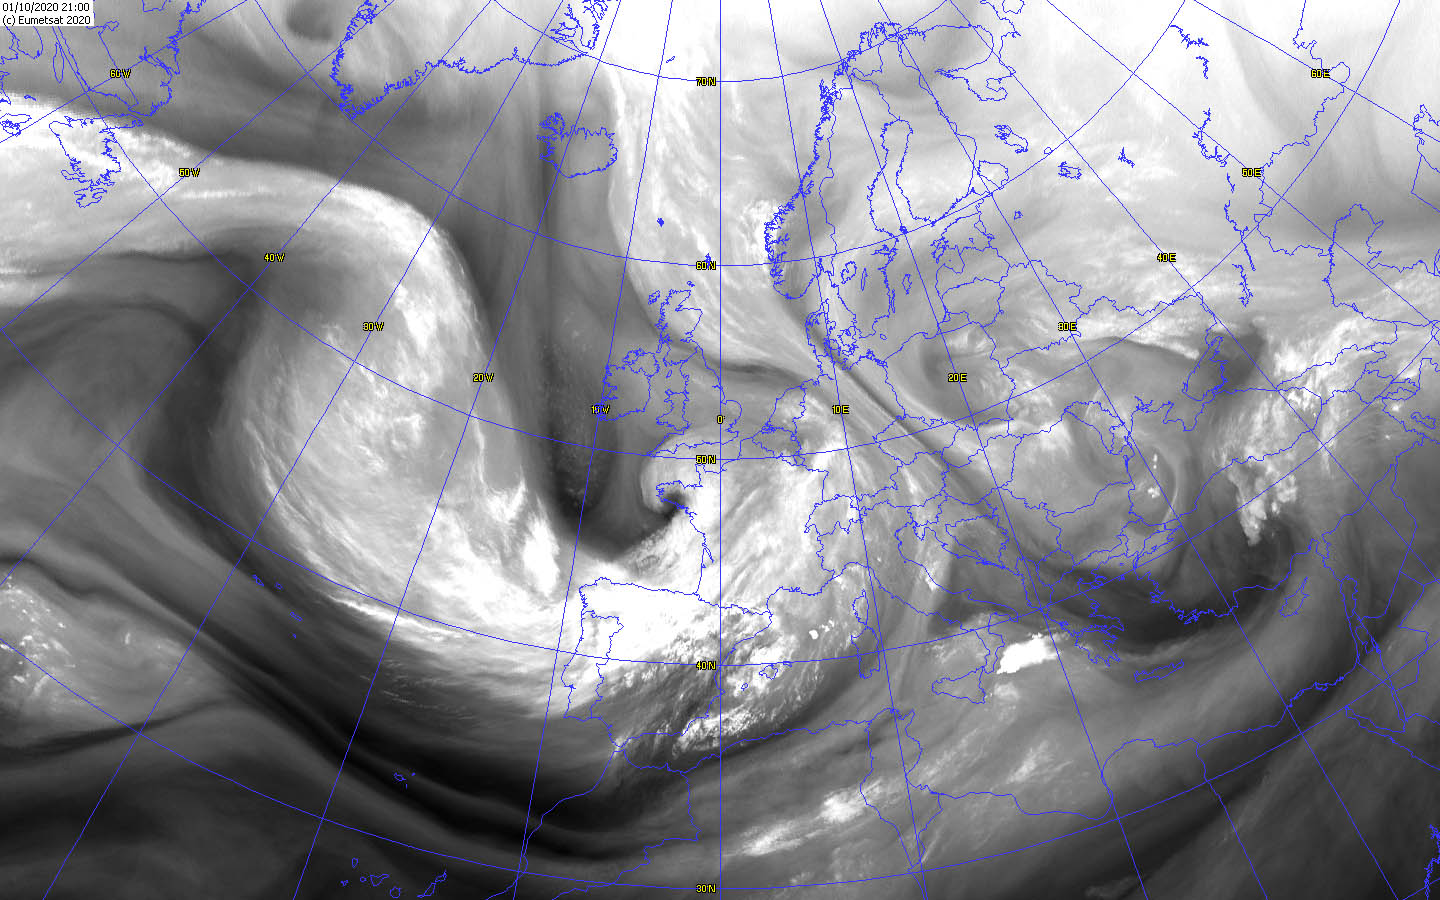
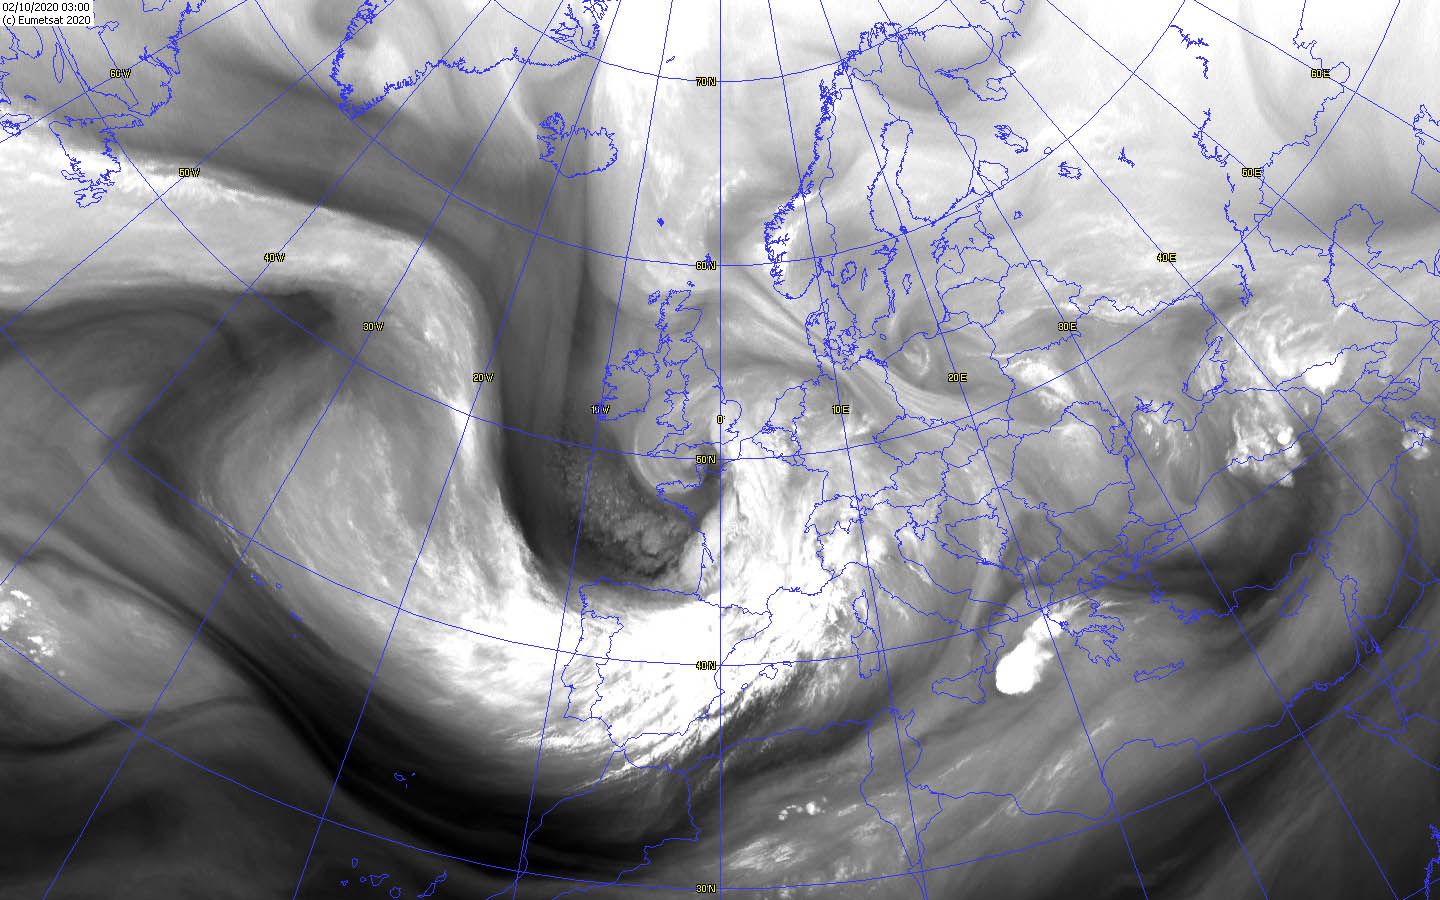
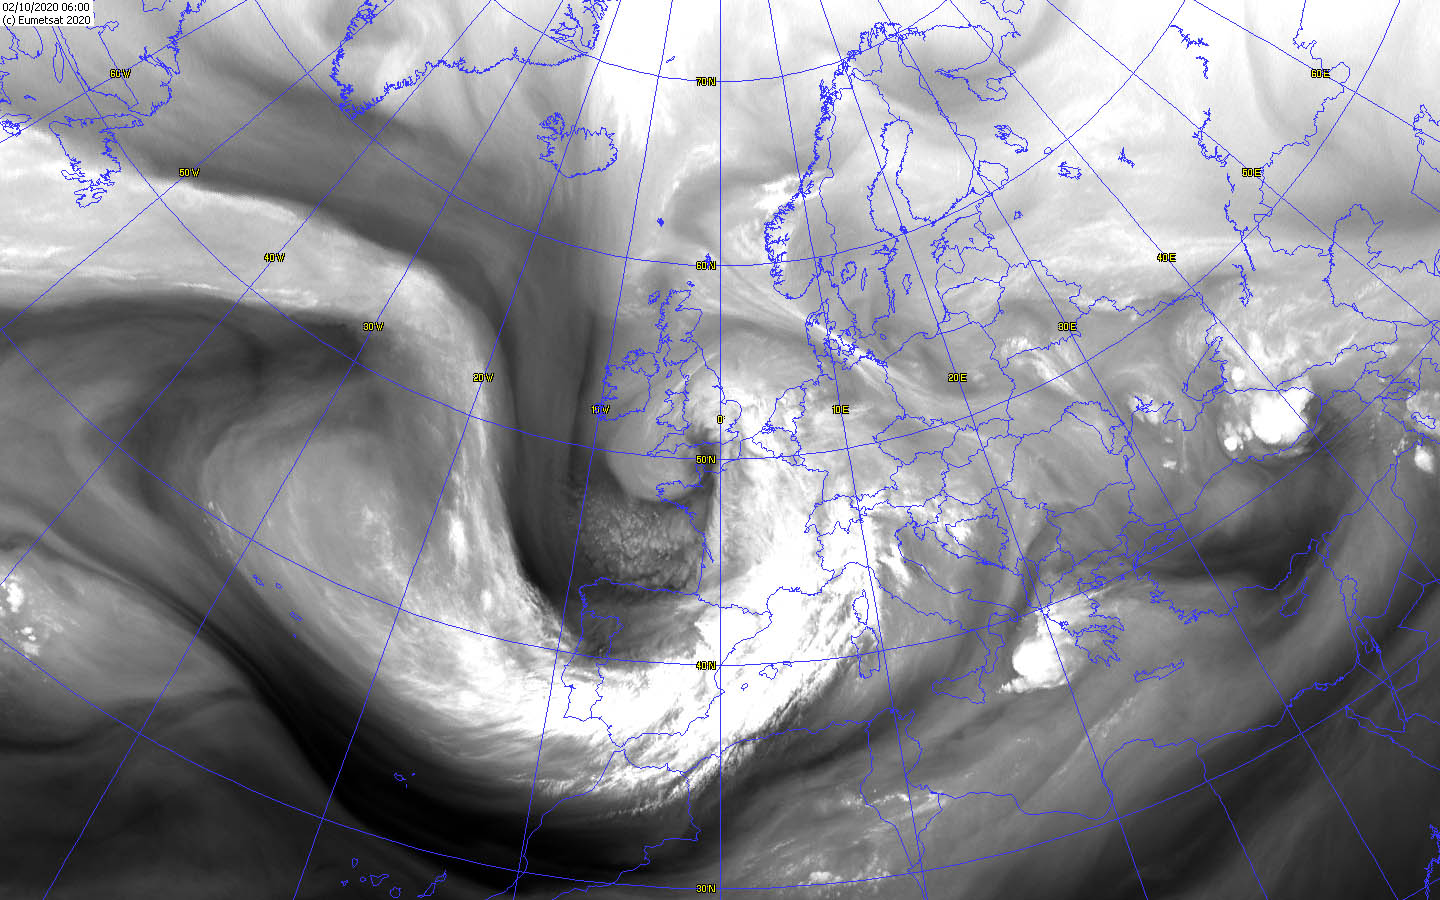
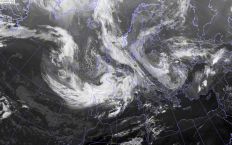
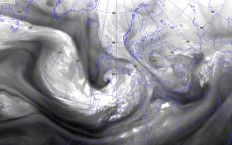
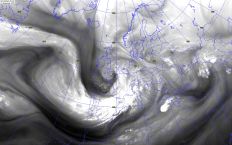
Satellite images (WV), October 02, Source:
Wokingham
|
 |
 |
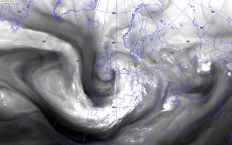 |
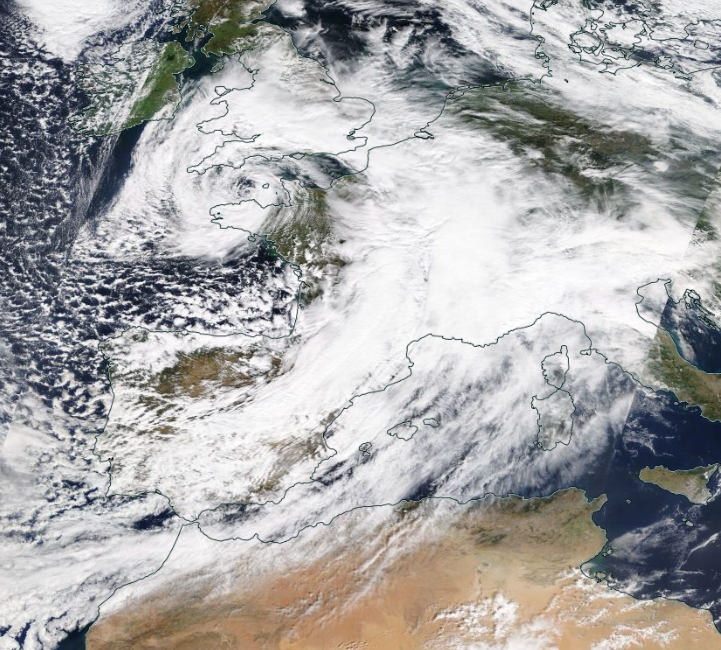
BRIGITTE was a so-called Shapiro-Keyser cyclone. One of most striking feature of these cyclones is the warm front. This front wraps around the center of the low
pressure system at its tip (bent back warm front) and also has a massive cloud cover at its tip (cloud head). These features are very well visible on the sea level
pressure weather map on 3 October 00 UTC. On the satellite images in the visible channel the enormous cloud head and the warm front is also visible
(see satellite image from October). The cold front, on the other hand, is only weakly pronounced in Shapiro-Keyser cyclones and is also no longer connected to the
warm front (frontal fracture) (see Ground Weather Chart October 2, 00UTC). Therefore, Shapiro-Keyser cyclones do not have an occlusion like the classic Norwegian
cyclone. Shapiro-Keyser cyclones are often accompanied by a so-called Sting Jet. This is a strong wind band that forms at the top of the warm front and can transport
the enormous wind speeds to the ground. This was also the case with BRIGITTE. Over Western France, the Sting Jet reached down to the ground and caused wind speeds of
over 200 km/h. The Sting Jet is mainly recognizable by bands of cloud at the top of the cloud head, which are caused by the sinking of air masses
(see IR satellite image on October 2 between 0 and 6 UTC). During this period the strongest gusts were also registered on the west coast of France.
The Dry Slot is also clearly visible at BRIGITTE. Dry air from the upper troposphere or lower stratosphere is transported along the cold front to the
center of the depression by a dry intrusion. The Dry Slot is often cloudless and reminds of the eye of a hurricane. Dry intrusion supports the
intensification of a depression and also exists in the classic Norwegian cyclones.
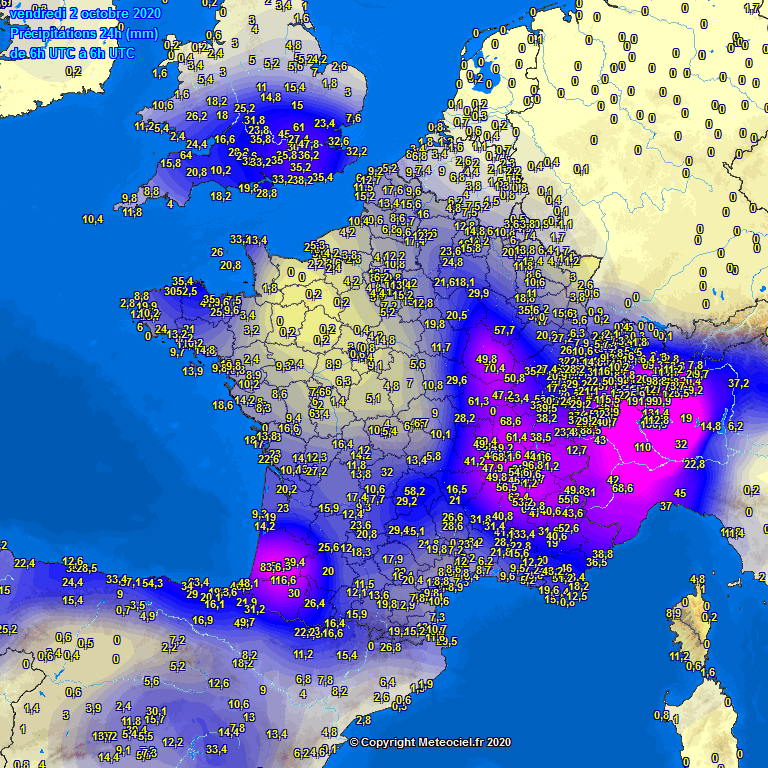
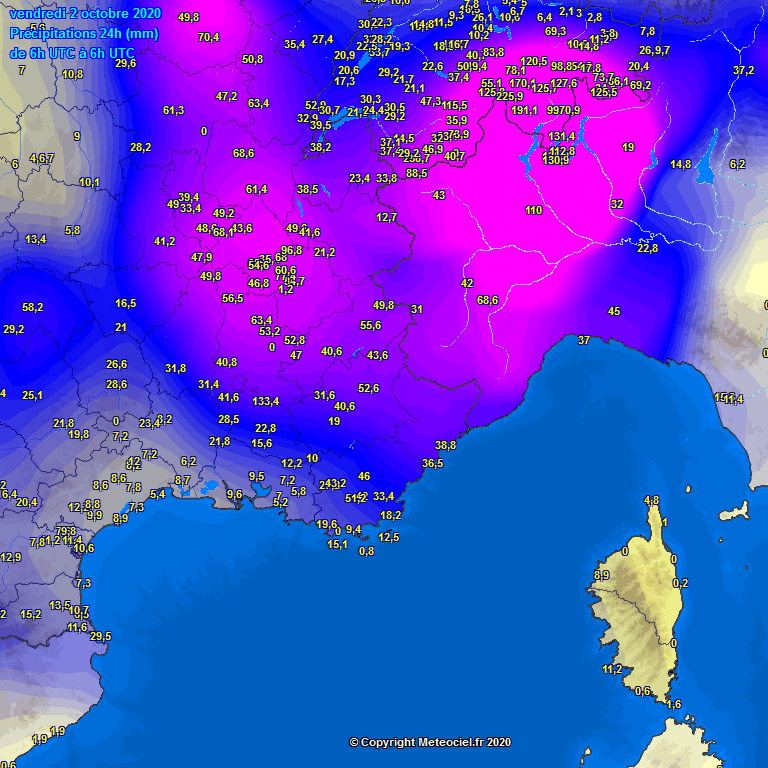
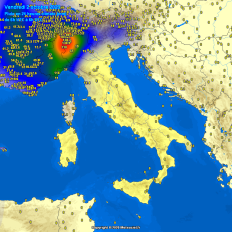
Besides the Sting Jet, the rainfall was also a striking feature of BRIGITTE. Along the massive warm front, significant amounts of rain fell in 24 hours
in southwestern Europe. Also in the alpine region large amounts of precipitation came together due to the south wind and the foehn. The southwest of Switzerland
and the northwest of Italy were particularly affected. This was already recognizable on October 1st and 2nd, as BRIGITTE showed striking positive vorticity
advection and layer thickness advection on its front side. The warm front and its precipitation reached northern Spain and western France in the night of
October 2 and spread to the southeast over the course of the day. As already mentioned, the strong southerly wind from the Alps on October 3 caused orographic
precipitation in the north of Italy and in Switzerland and resulted in large amounts of precipitation in only 24 hours. Due to the cold air advection at the
back of BRIGITTE, these precipitations fell as snow at high altitudes. Locally quantities around half a meter of fresh snow came together.
|
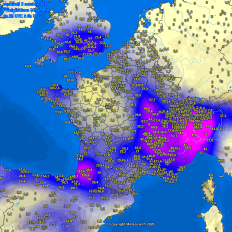
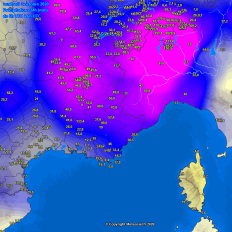
Precipitation amount and type of precipitation, October 01-04, 2020:
Wetter3
|
 |
 |
 |
 |
|
Precipitation amount and type of precipitation, October 01-04, 2020:
Wetter3
|
 |
 |
 |
 |
|
Precipitation amount over Europe, October 02 and 03, 2020:
Meteociel
|
 |
 |
 |
Below is a selection of peak gusts and fallen precipitation.
| Location |
Gusts in km/h |
Date |
Le Talut (FR)
Beg Melen (FR)
Estaca De Baries (ESP)
Belle Ile (FR)
Gütsch (SW)
Elm
Patscherkofel (AU)
Ile De Groix (FR)
Piz Martegnas (SW)
Barfleur Point (FR)
Titlis (SW)
Jungfrauenjoch (SW)
Matro (SW)
Patscherkofel (AU)
Gütsch (SW)
Elm (SW)
Alpinzentrum Rudolfshütte (AU)
Loferer Alm (AU)
Gornergrat (SW)
Sonnblick (AU)
Cimetta (SW)
Säntis (SW)
Villacher Alpe (AU)
Gütsch (SW)
Chasseral (SW)
|
162
158
122
168
167
159
158
157
152
148
144
143
181
176
169
159
158
151
148
144
144
143
140
143
139
|
01.10.2020
01.10.2020
01.10.2020
02.10.2020
02.10.2020
02.10.2020
02.10.2020
02.10.2020
02.10.2020
02.10.2020
02.10.2020
02.10.2020
03.10.2020
03.10.2020
03.10.2020
03.10.2020
03.10.2020
03.10.2020
03.10.2020
03.10.2020
03.10.2020
03.10.2020
03.10.2020
04.10.2020
04.10.2020
|
|
| Location |
Precipitation amount in mm/24h |
Date |
Robiei (SW)
Binn (SW)
Brugg-Wildegg (SW)
Locarno-Monti (SW)
Cevio (SW)
Magadino (SW)
Lugano (SW)
Capo Mele (IT)
Milano/ Malpensa (IT)
Monte Settepani (IT)
Fionnay (SW)
Robiei (SW)
Binn (SW)
Brugg-Wildegg (SW)
Kötschach/ Mauthen (AU)
Piotta (SW)
Dellach im Drautal (AU)
|
173,0
162,0
144,0
143,0
138,2
100,9
99,0
95,0
86,0
65,0
256,7
225,9
149,4
143,6
116,0
97,4
81,0
|
02.10.2020
02.10.2020
02.10.2020
02.10.2020
02.10.2020
02.10.2020
02.10.2020
02.10.2020
02.10.2020
02.10.2020
03.10.2020
03.10.2020
03.10.2020
03.10.2020
03.10.2020
03.10.2020
03.10.2020
|
|
Data source: Ogimet and Meteociel
Text: MG
October 13, 2020
|