|
Extratropical Cyclone LUIS II produced wind speeds up to 115 kph and precipitation amounts of more
than 100 mm/24h in the Iberian Peninsula and France such as in Italy and the Alps.
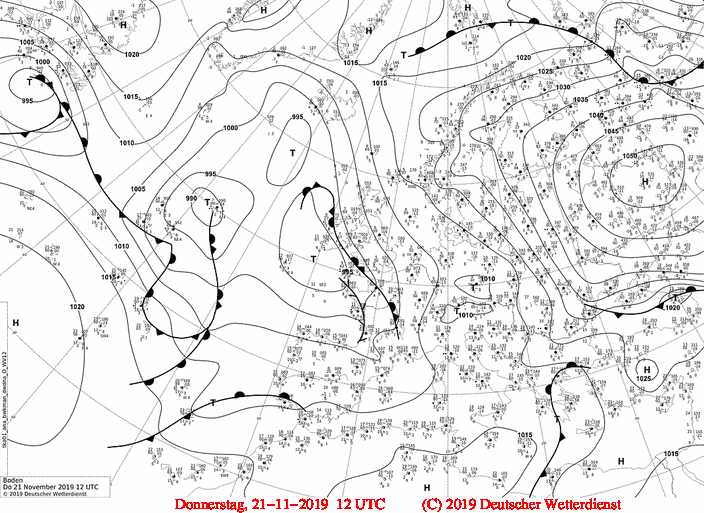
Low pressure area LUIS developed on 19 and 20 November from a trough with rather low intensity but large spatial extension (from Greenland
to the northern Sahara). In the evening of 20 November, the depression became almost stationary west of the British Isles. Several thousand
kilometres east of it, a wave disturbance formed another depression, which was subsequently declared LUIS II. Due to a favourable
crossing of a jetstreak, i.e. an area with strongly crowded isohypsis, LUIS II intensified rapidly and passed LUIS I southly, which
slowly moved over the south of the British Isles and weakened.
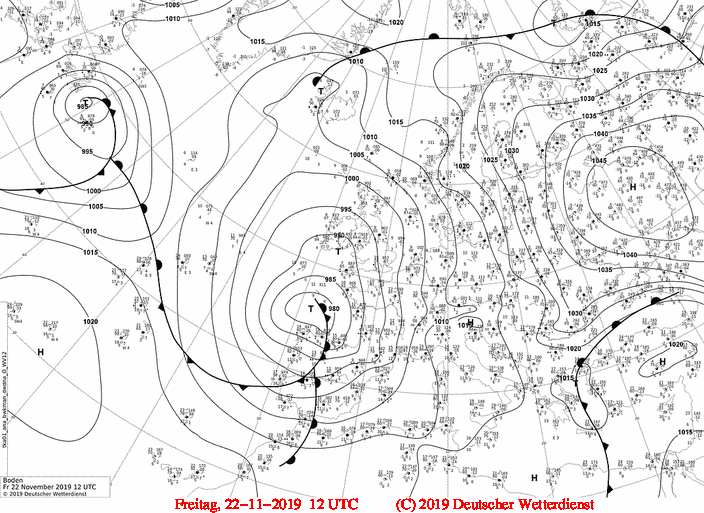
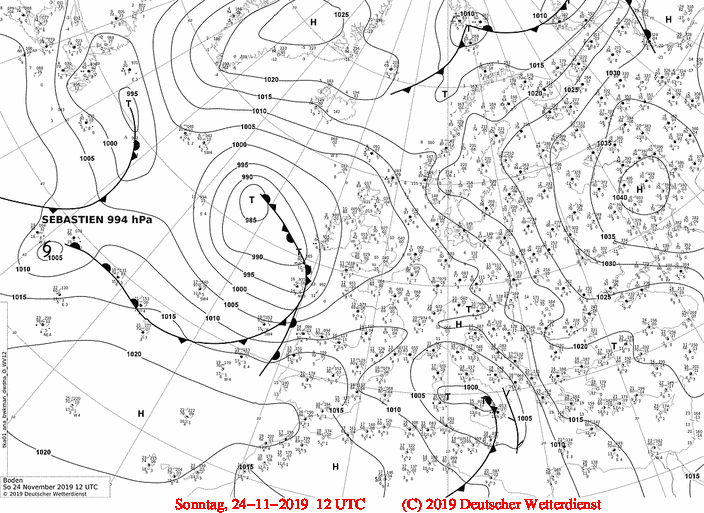
In the night from 22 to 23 November, LUIS II moved across the Bay of Biscay with a central pressure of approx. 980 hPa and reached the
coast of southwest France on 23 November. Especially south of the centre, on the Atlantic coast of the Iberian peninsula, there were
stormy winds and abundant precipitation. The Spanish station Sevilla marked the maximum value with 113.5 mm/24h. The accompanying
trough extended over the Iberian peninsula to North Africa.
|
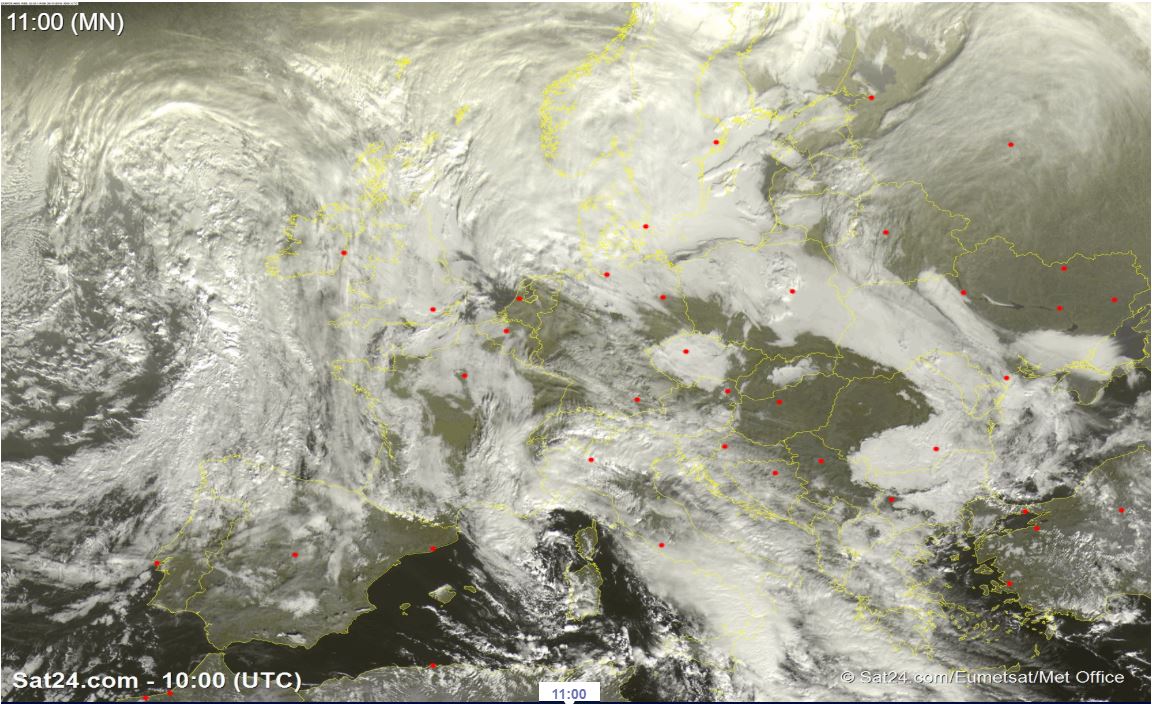
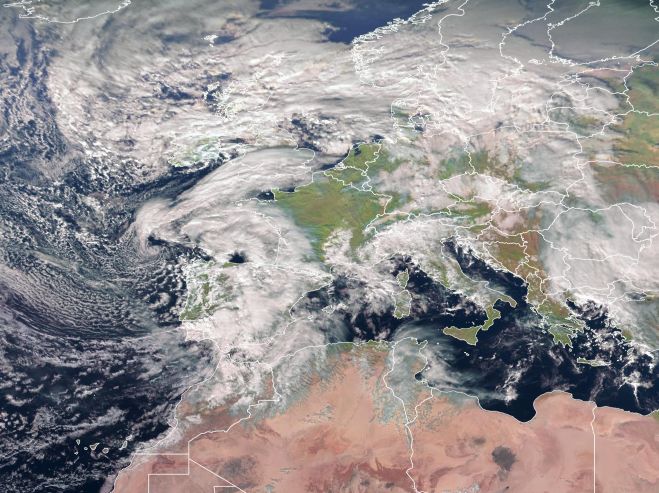
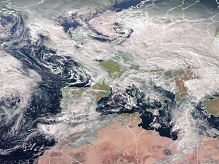
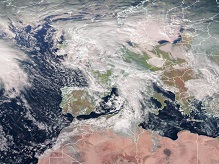
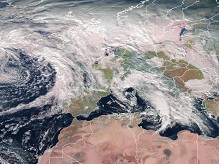
Satellite image (visible) from 22 until Nov 25, 12 UTC,
Source: Eumetview
|
 |
 |
 |
 |
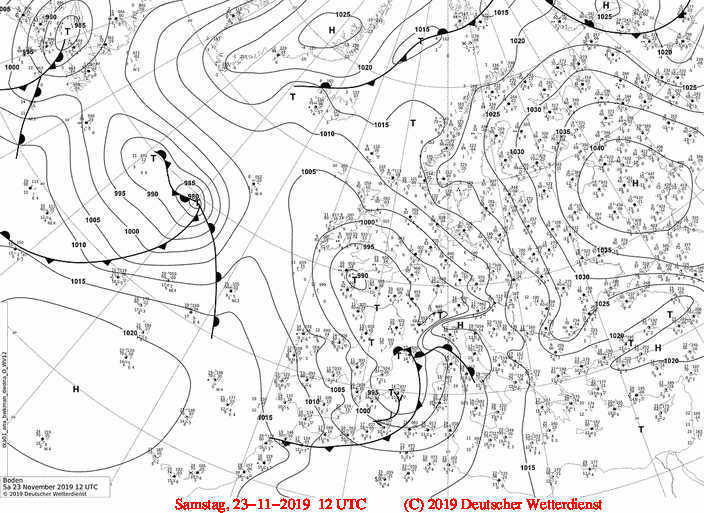
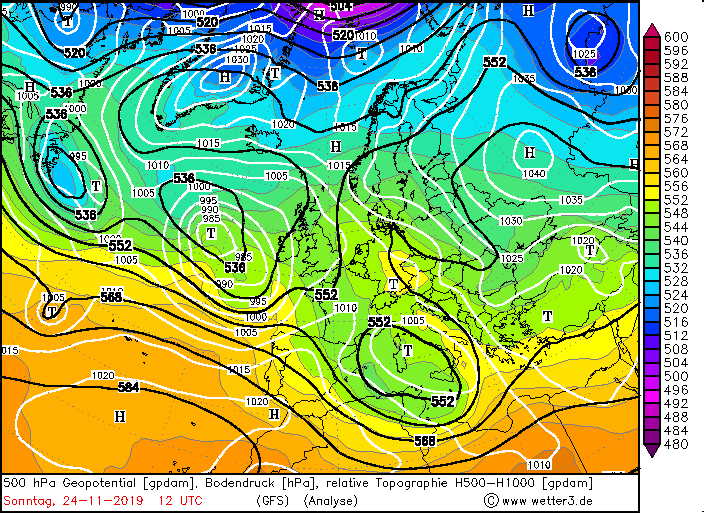
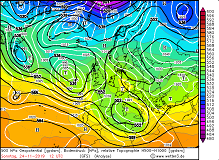
As the jetstreak of the trough still was located west of the trough axis, its amplitude continued to increase and LUIS II moved further
in a southeasterly direction until it reached the mediterranean sea at the Spanish-French coast in the evening of November 23rd. LUIS II
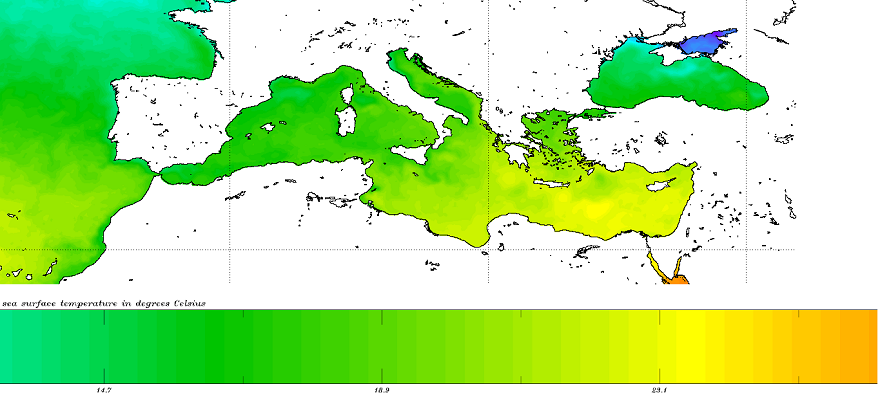
encapsulated itself from the accumulating trough and became a cut-off low over the Mediterranean. The surface temperature of the western
Mediterranean, which had already cooled down to approx. 16°C and was still sufficient to supply the depression with some energy, but no
longer to form a Medicane.
|
Mediterranean sea surface temperature, end of November 2019,
Source: NOAA
|
 |
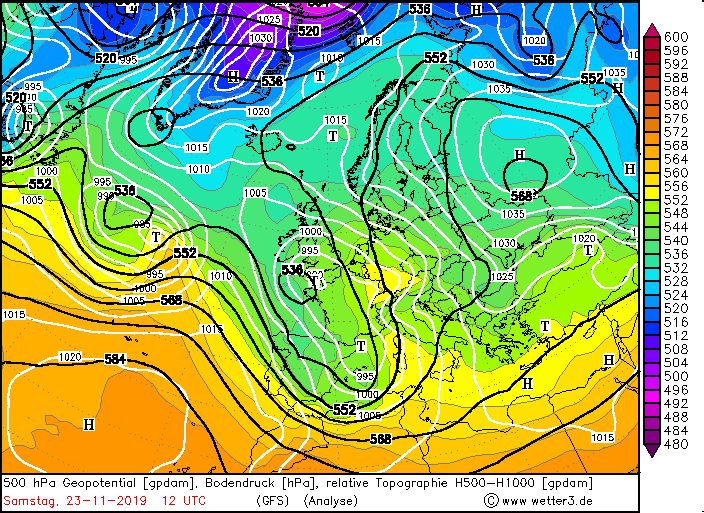
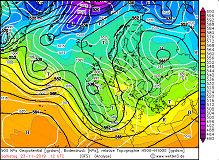
LUIS II moved further east via the Strait of Bonifacio between Corsica and Sicily. Strong mistral winds occurred at the back of the cyclone.
Ships in the western Mediterranean reported up to 112 kph mean wind from northwesterly direction. At the front of LUIS II, positive layer
thickness advection and with height increasing vorticity advection led to strong uplift and abundant precipitation.
|
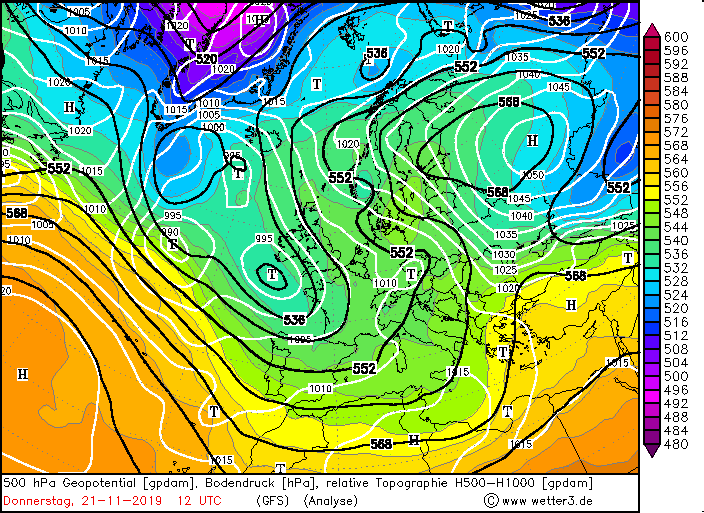
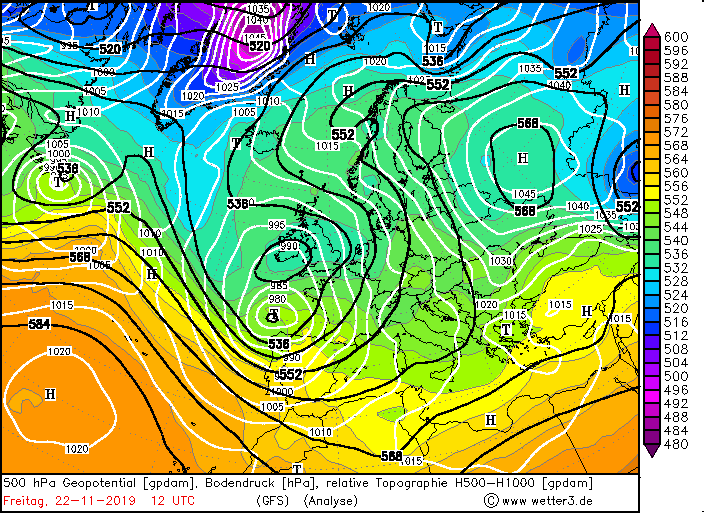
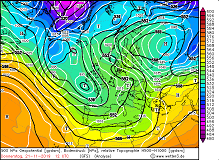
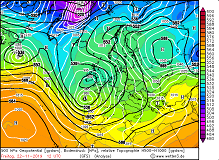
500 hPa Geopotential, Nov 22 until Nov 25, 12 UTC,
Source: wetter3
|
 |
 |
 |
 |
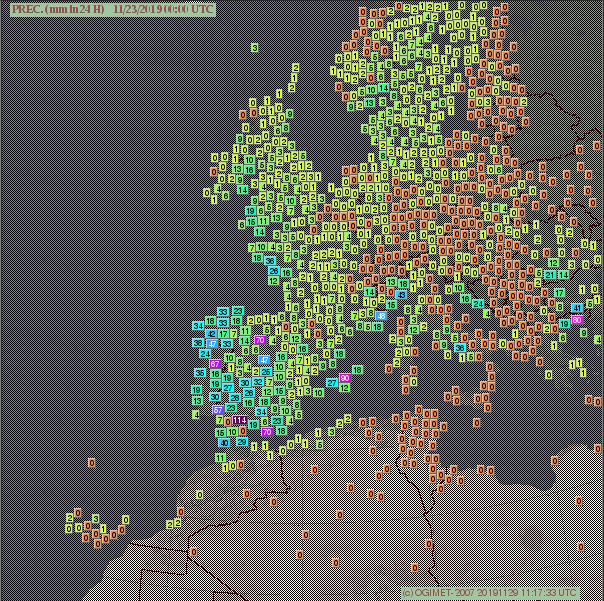
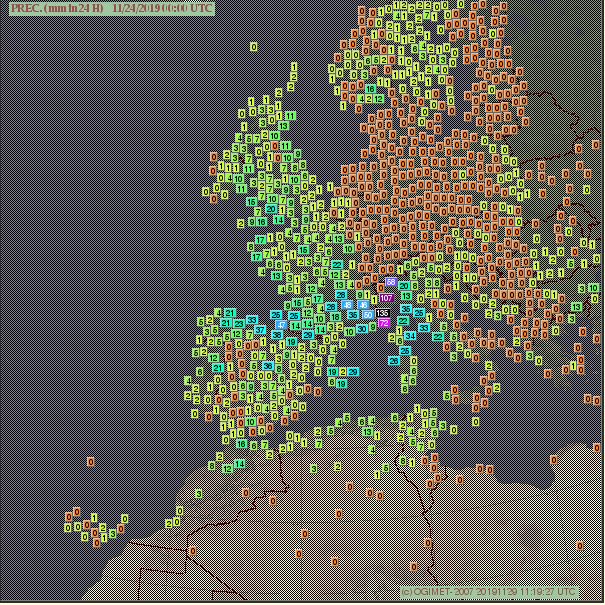
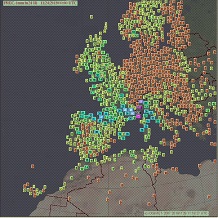
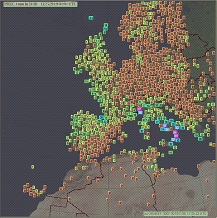
The largest amounts of were caused by orographic rain in Cannes and Nice, where the Alps reach close to the Mediterranean Sea.
Turin also had more than 100 mm precipitation within 24 hours. In the eastern part of the Alps strong foehn winds were caused by
the southern inflow. On 24 November gusts of 154.9 kph were measured on the Patscherkopfel in Austria.
|
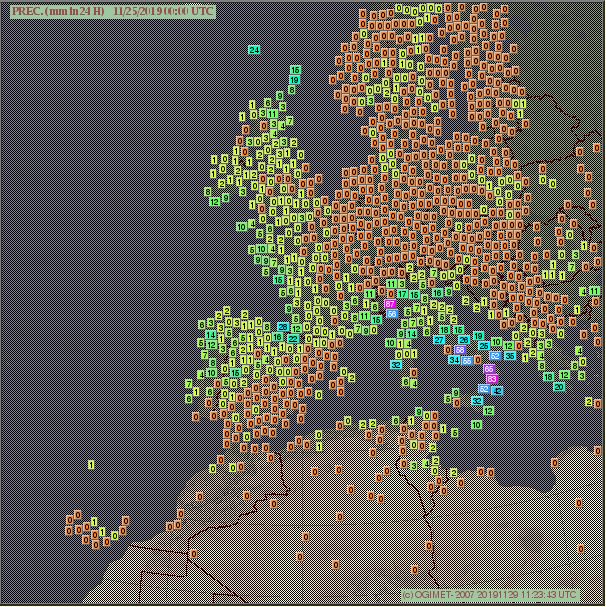
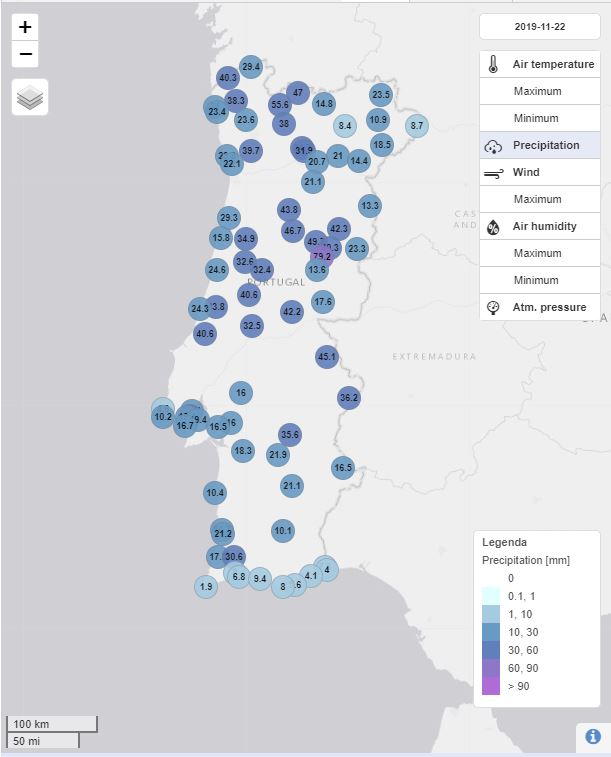
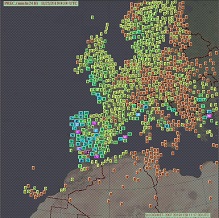
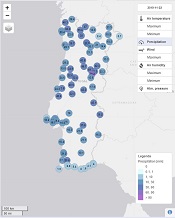
Europe 24 hour precipitation of Nov 22 until Nov, 24 hour precipitation from Nov 22 (Portugal),
Source: Ogimet and
Source: IPMA
|
 |
 |
 |
 |
At the north side of the Alps the phenomenon was noticeable with unusual high temperatures. In the winter sports resort
of Garmisch-Partenkirchen (700 m above sea level), temperatures on 24 and 25 November reached 16.8 and 15.1°C respectively.
| Location |
24 h precipitation amount |
Date |
Sevilla / San Pablo (ES)
Porto Colom (ES)
Covilha (PT)
Motril / Club Nautico (ES)
Cervera De Pisuerga (ES)
Visue (PT)
Cannes (FR)
Torino / Caselle (IT)
Nice (FR)
Binn (CH)
Torino / Caselle (IT)
Monte Settepani (IT)
|
113.5
90.0
79.2
70.0
70.0
67.0
135.2
107.0
72.0
58.5
87.0
55.8
|
23.11.2019, 0 UTC
23.11.2019, 0 UTC
23.11.2019, 0 UTC
23.11.2019, 0 UTC
23.11.2019, 0 UTC
23.11.2019, 0 UTC
24.11.2019, 0 UTC
24.11.2019, 0 UTC
24.11.2019, 0 UTC
24.11.2019, 0 UTC
25.11.2019, 0 UTC
25.11.2019, 0 UTC
|
|
Data source:
Source: Ogimet and
Source: IPMA
Text: FS
November 29, 2019
|