|
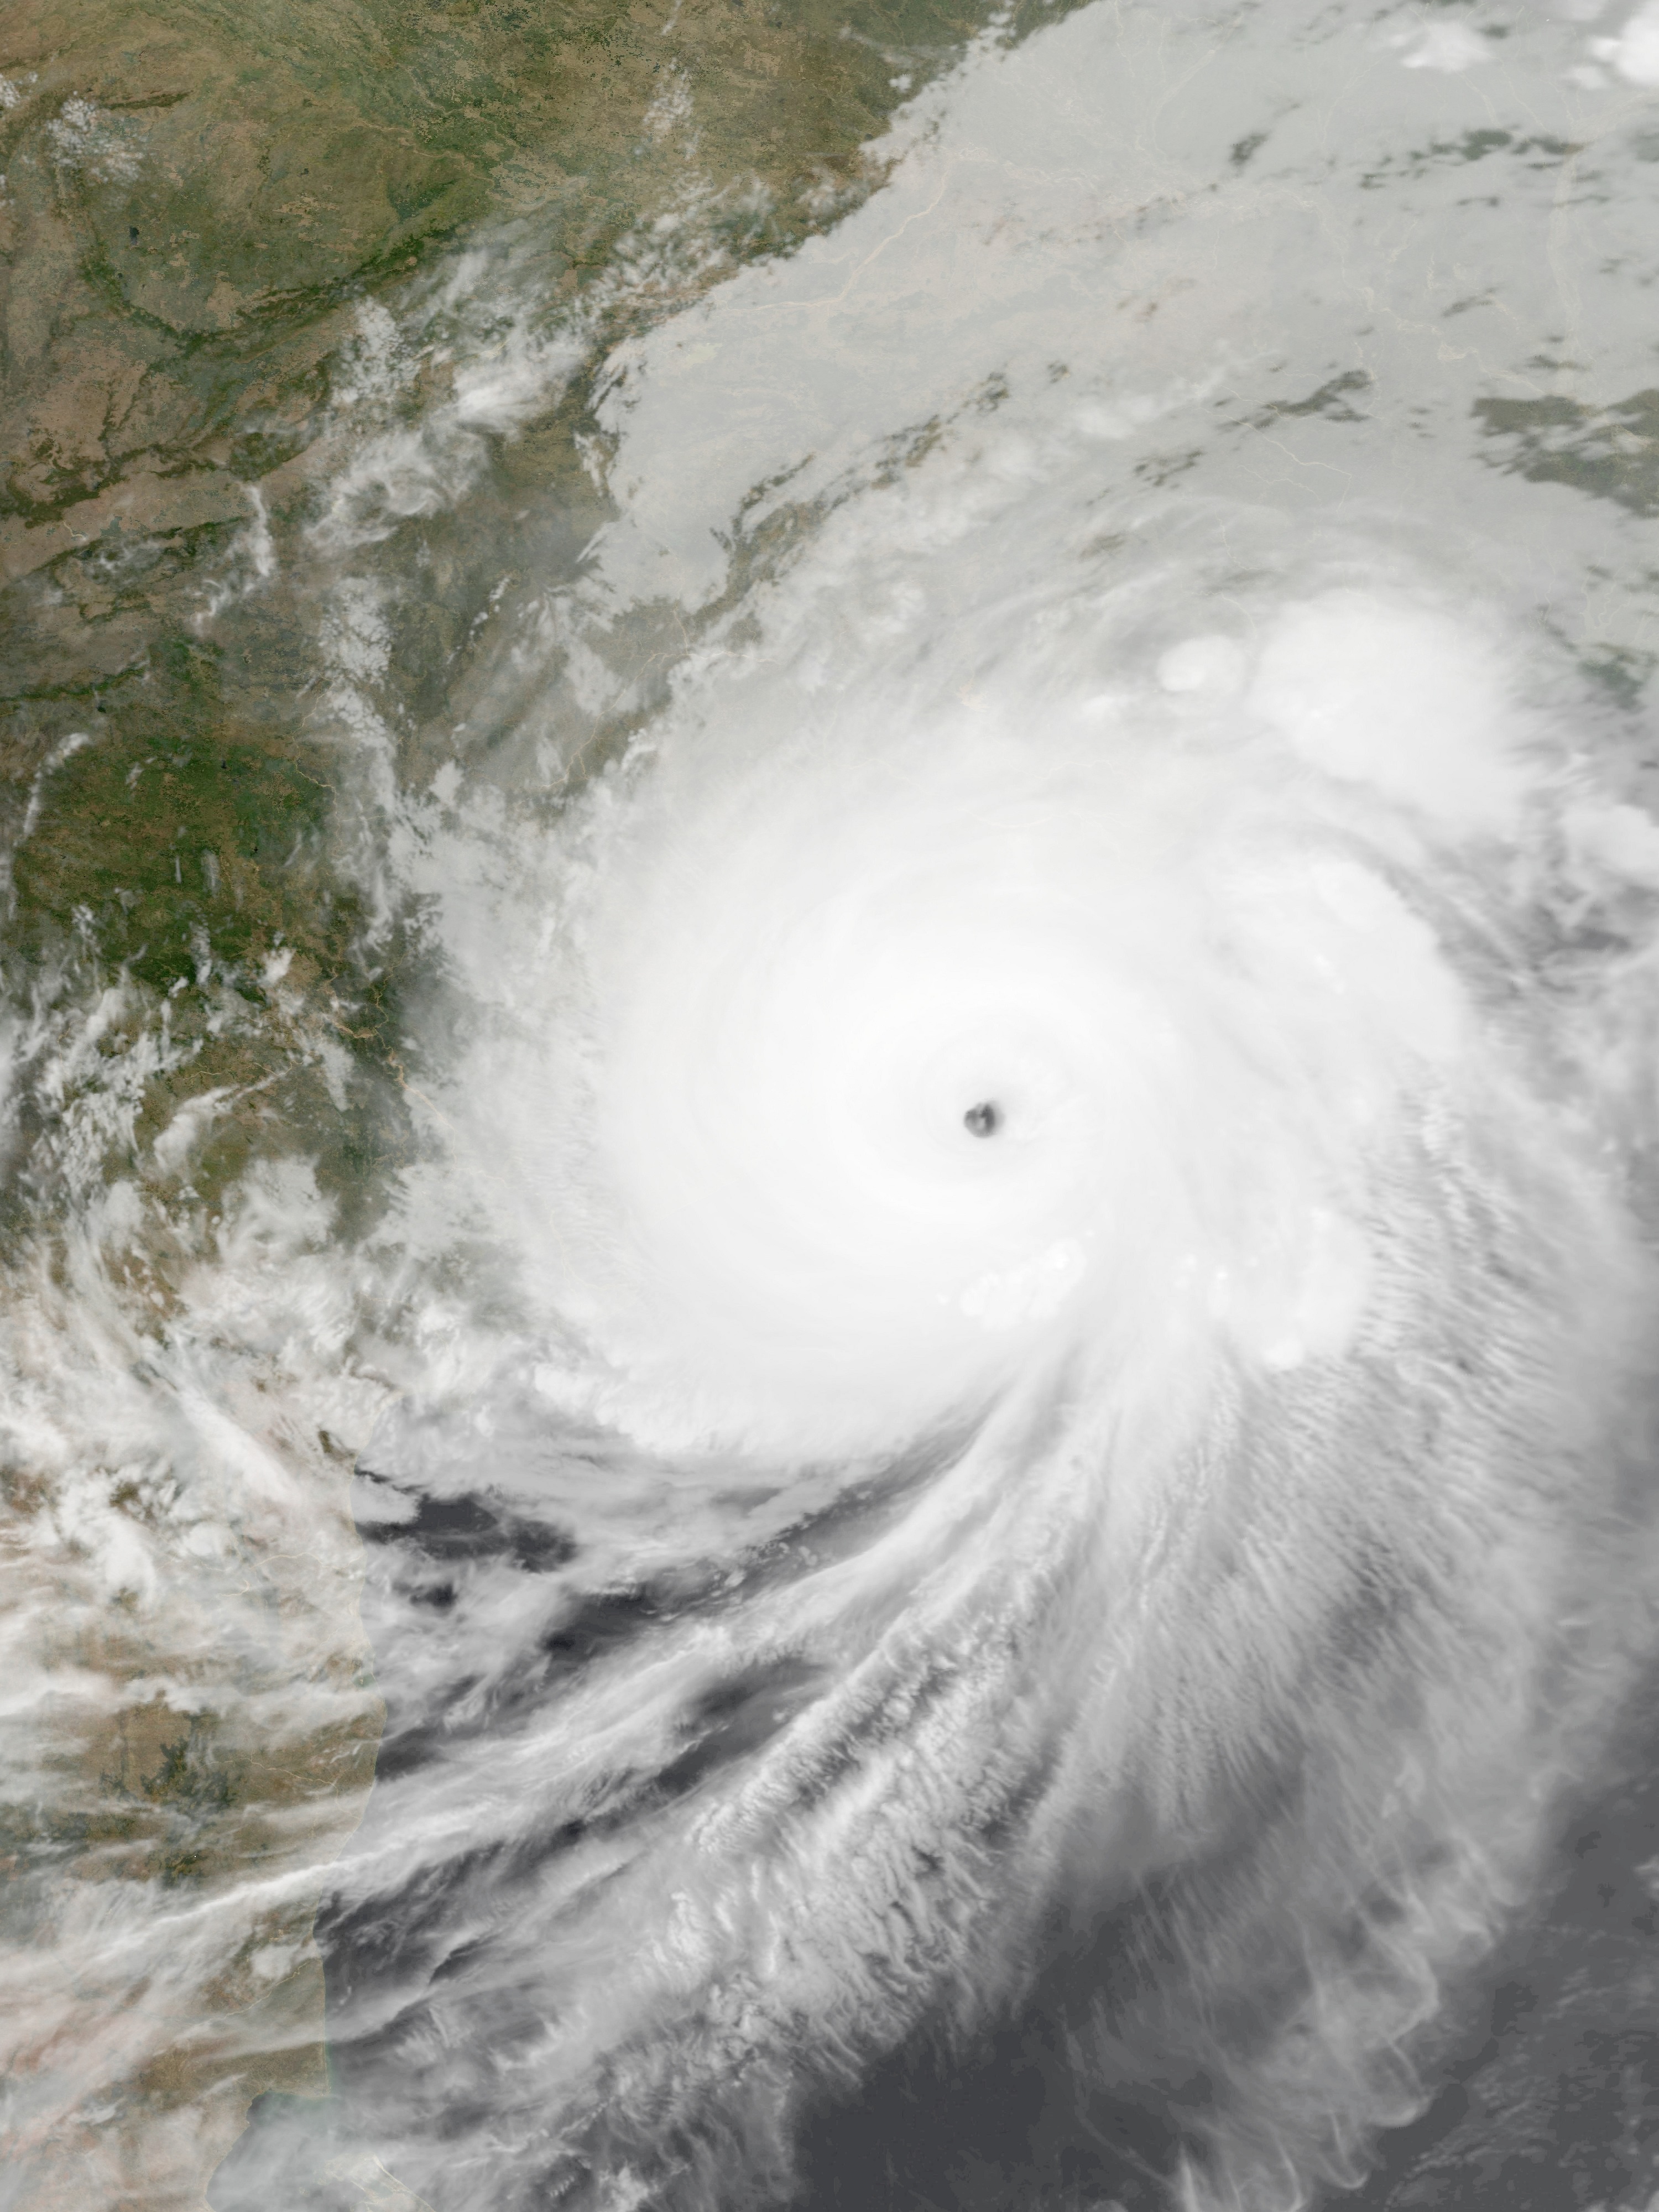
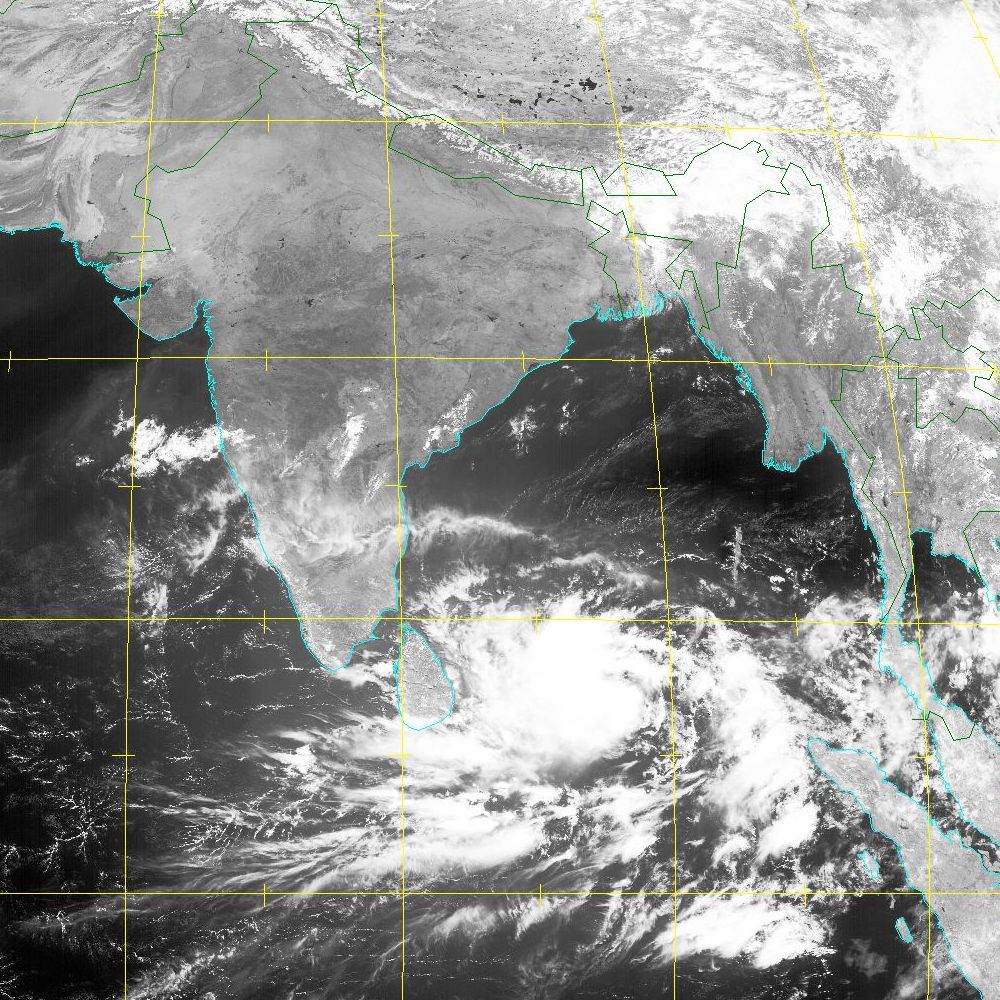
Sunday, May 05th, 2019, 20:00 CEST Tropical Cyclone FANI FANI India, Bangladesh May 02nd-05th , 2019 Satellite image (visible) from MAY 02th, 2019 Source: NASA Worldview |
|
|
FANI was the second named Storm of the 2019 Nort Indian Ocean cyclone Season. Originating from a
tropical depression formed on 26 April, FANI reached peak intensitiy on 02 May and made landfall
in Odisha (IN) as an extremely severe cyclonic Strom (short: ESCS) on 03 May. The highest measured
mean wind was 159 kph in Digha. The highest recorded 24 h precipitation was 276 mm in Cherrapunji.
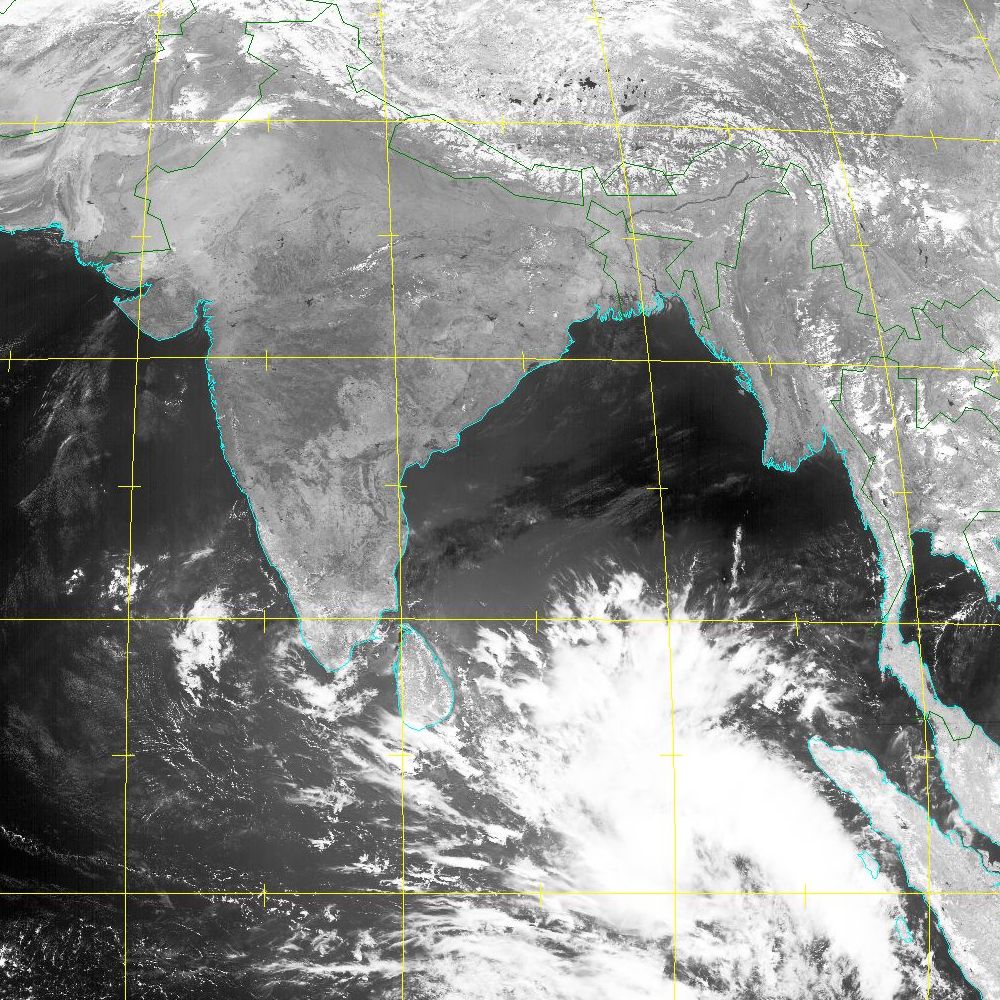
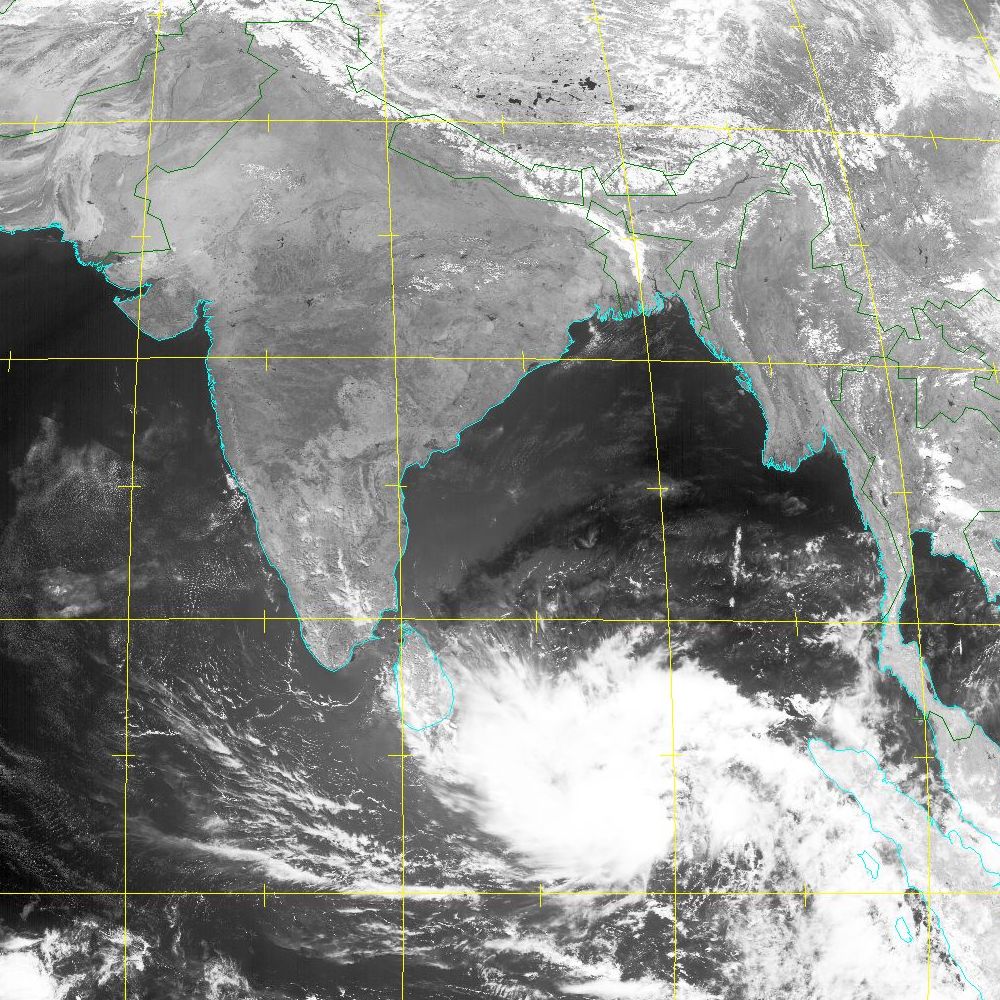
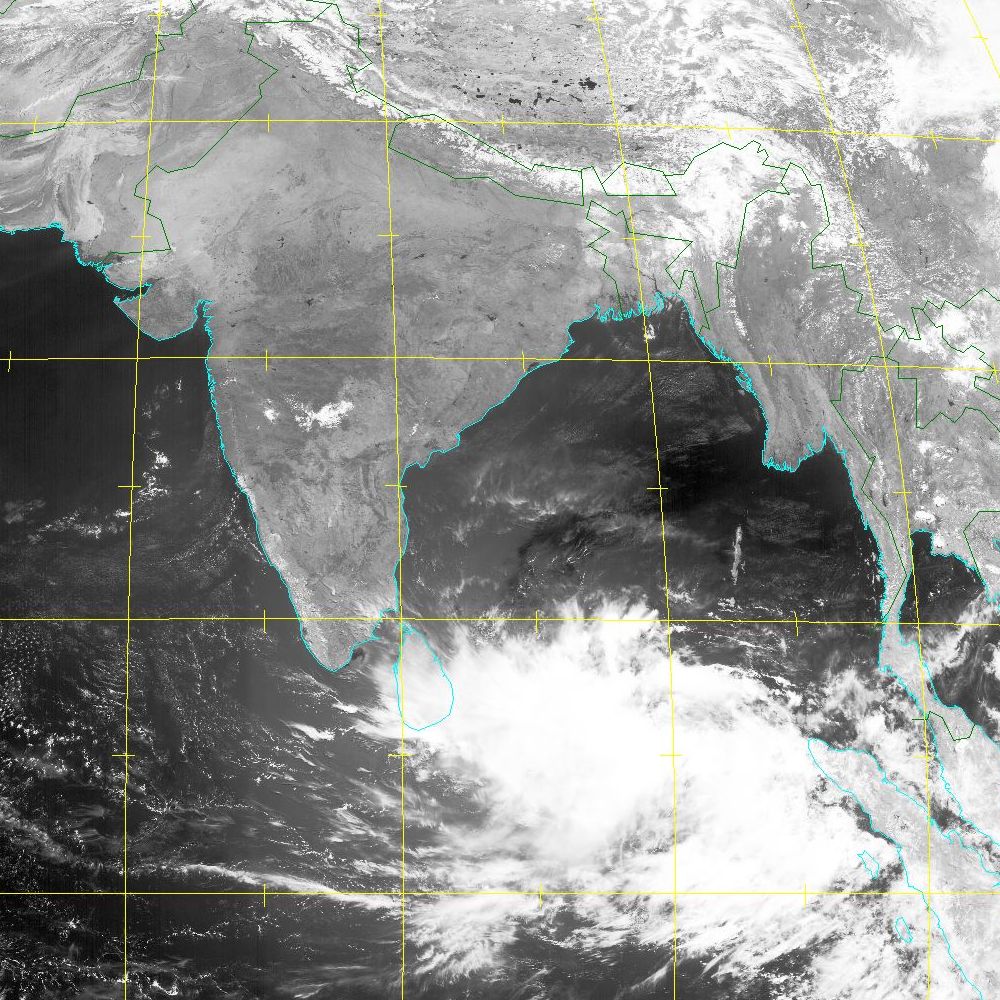
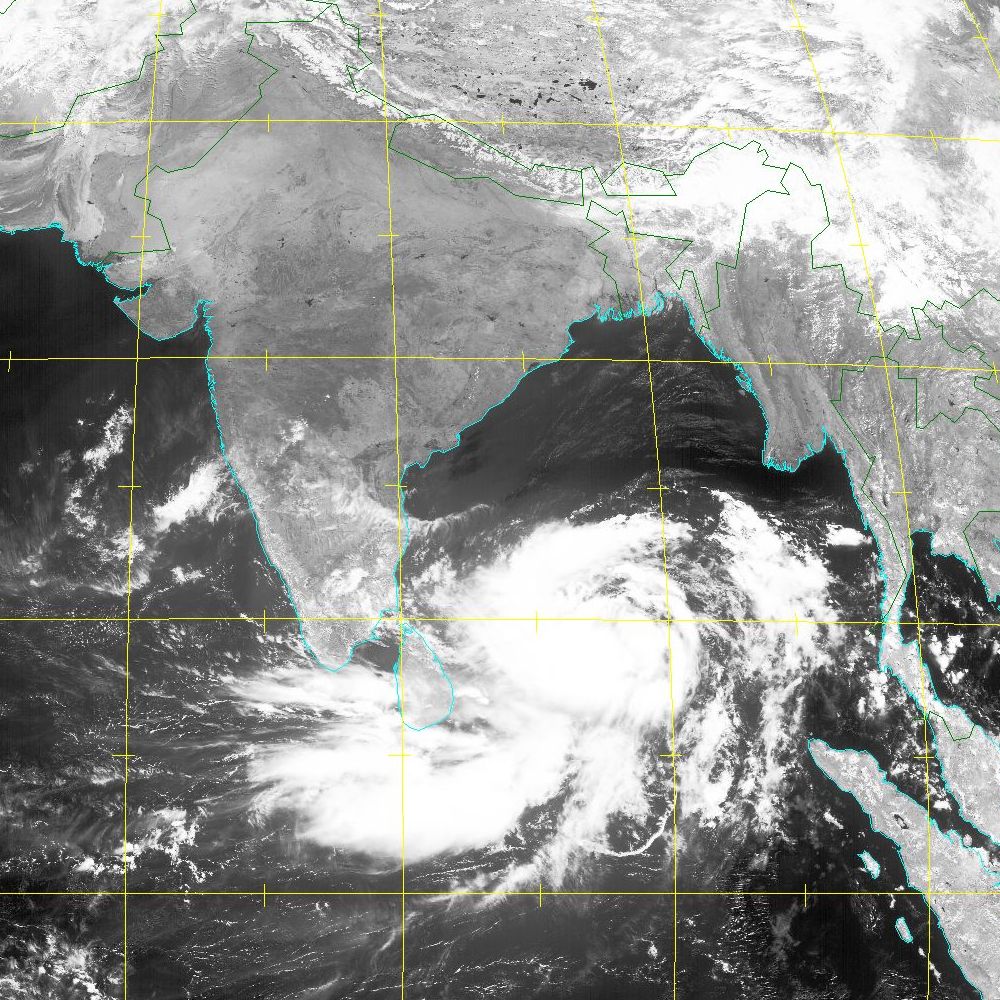
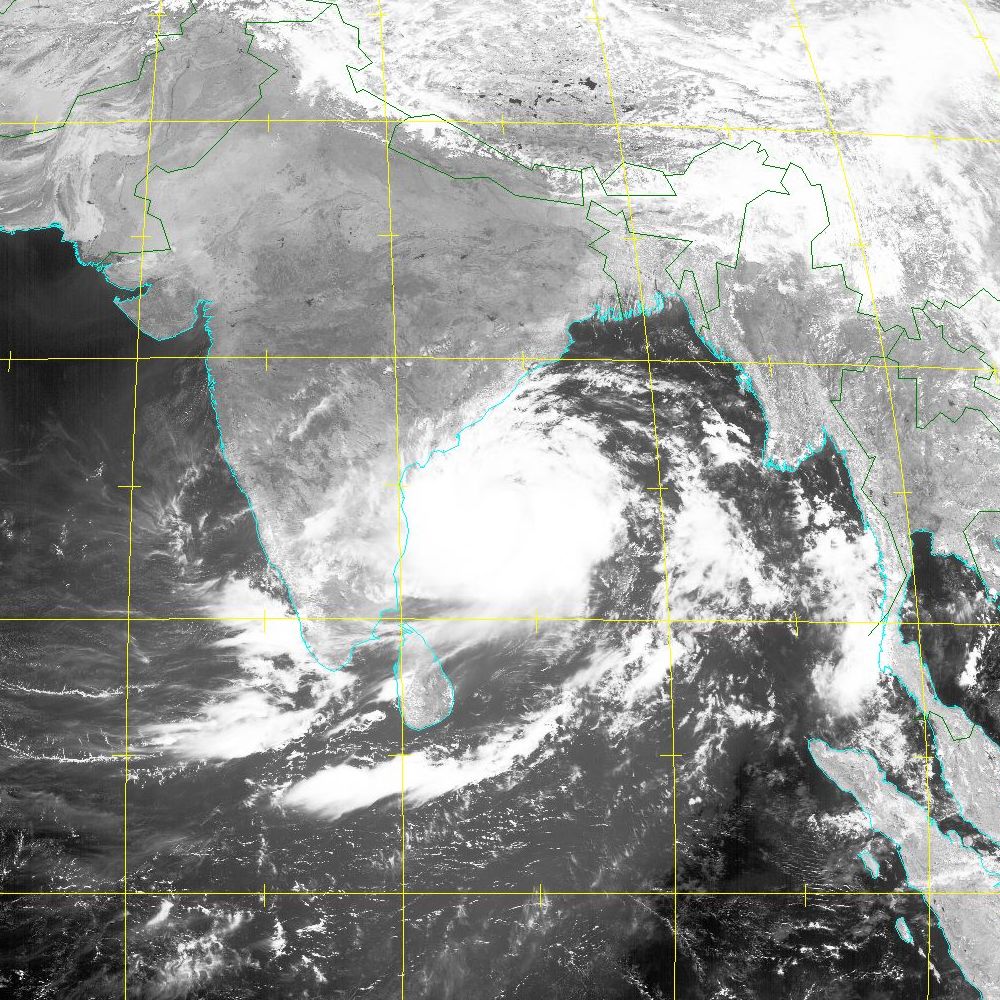
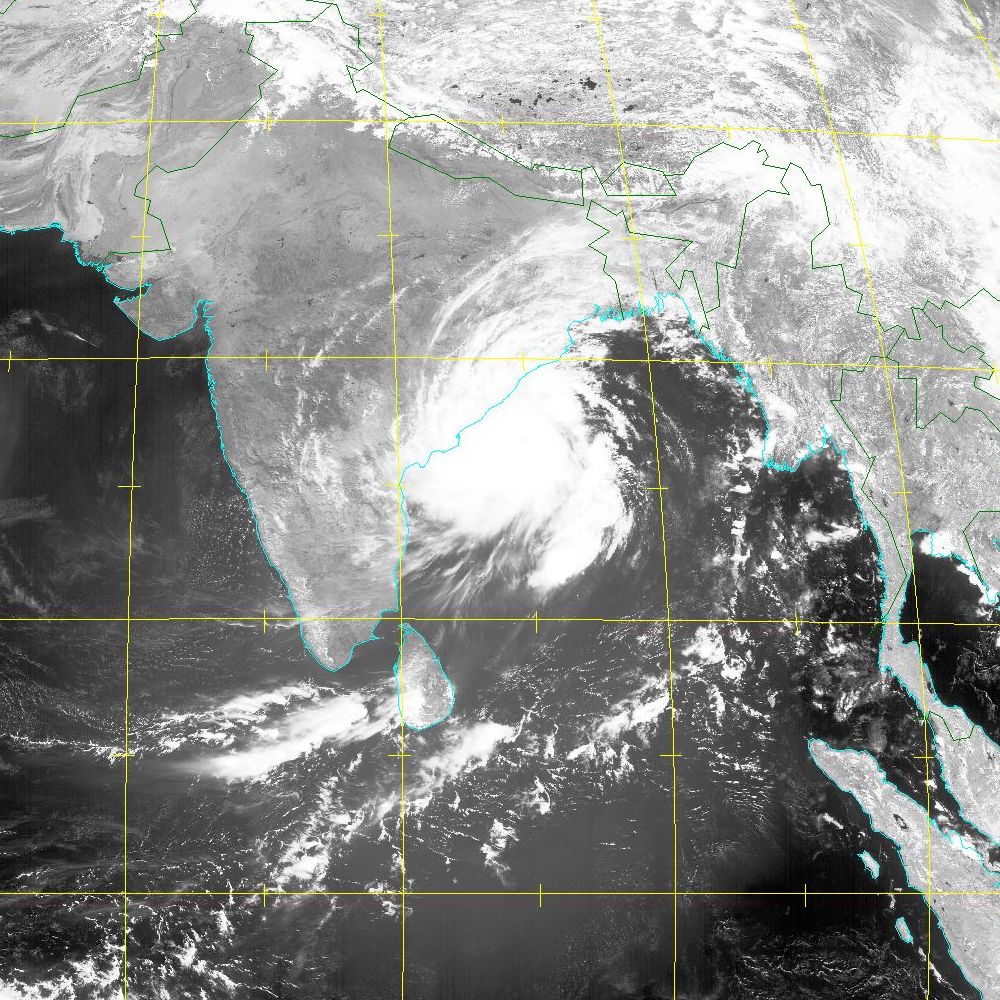
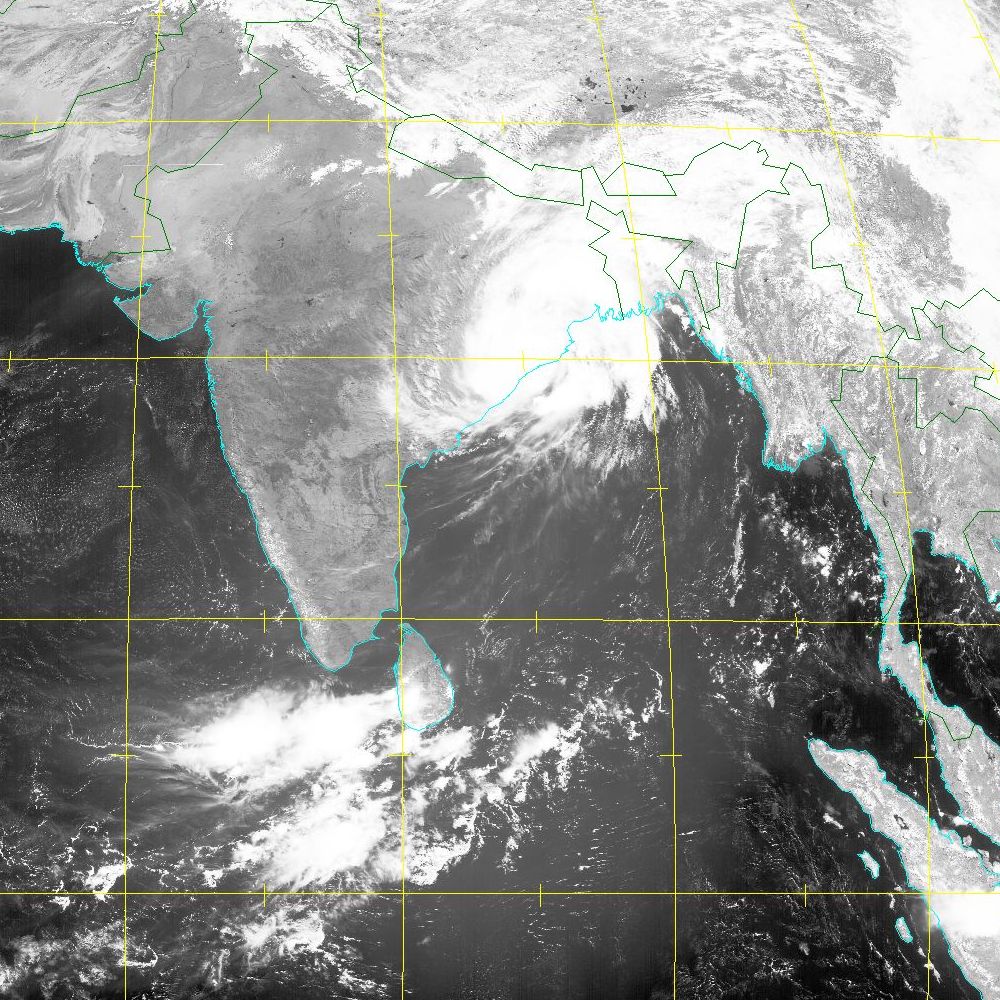
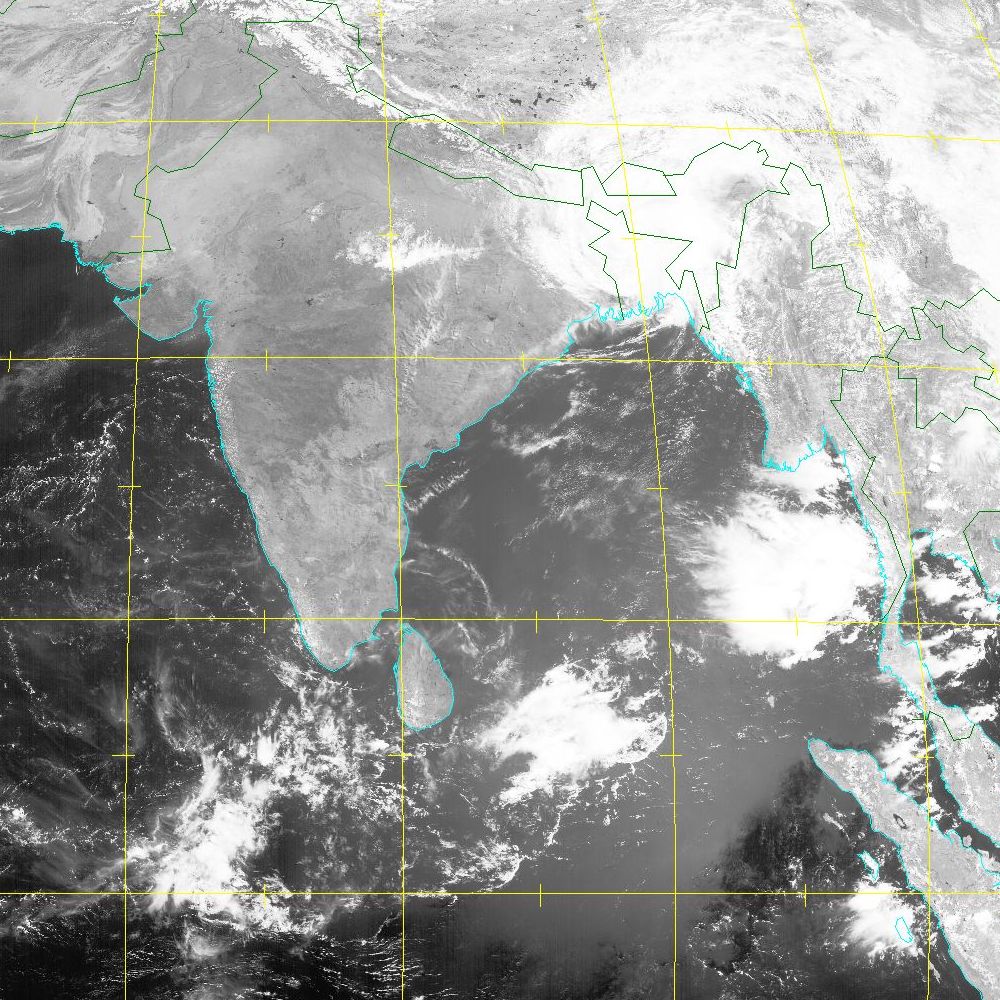
Evolution of FANI
FANIs development over the Bay of Bengal as seen from geostationary satellite GOMS.
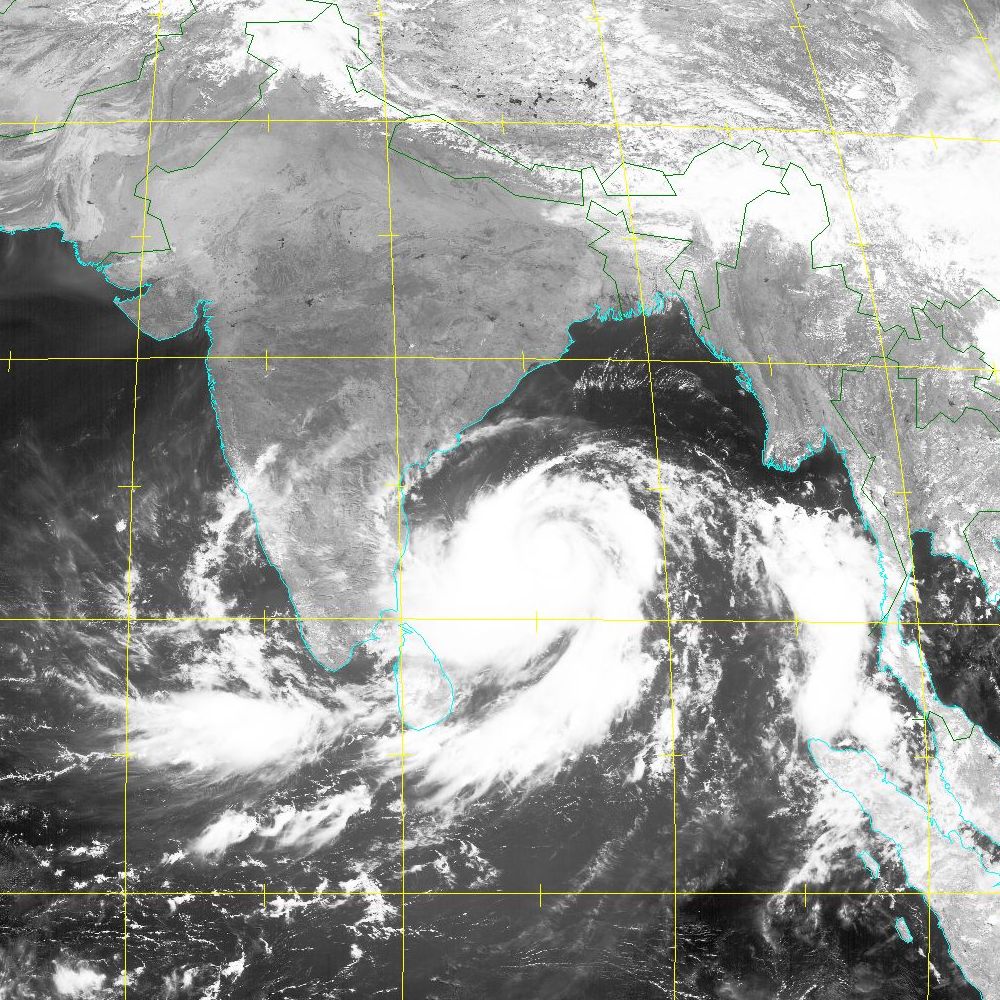
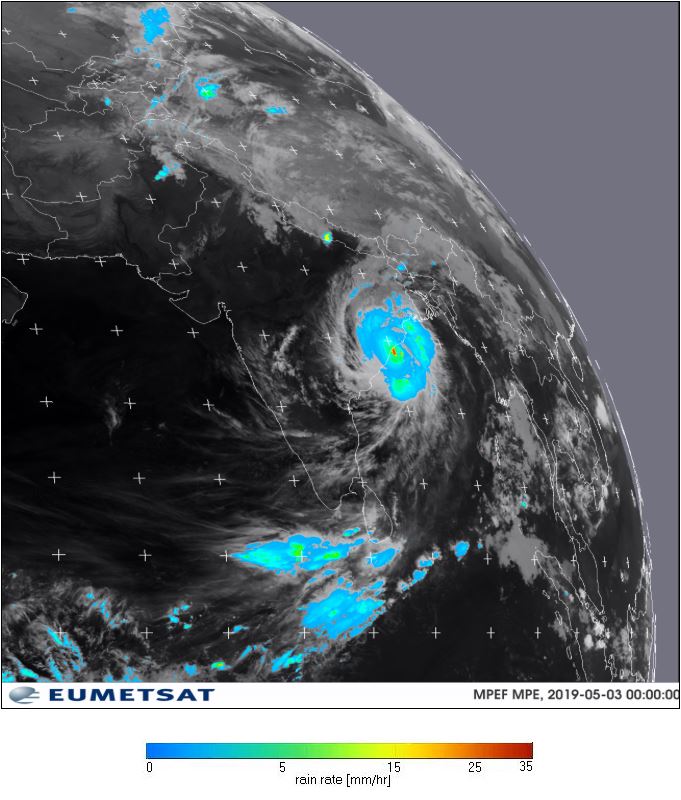
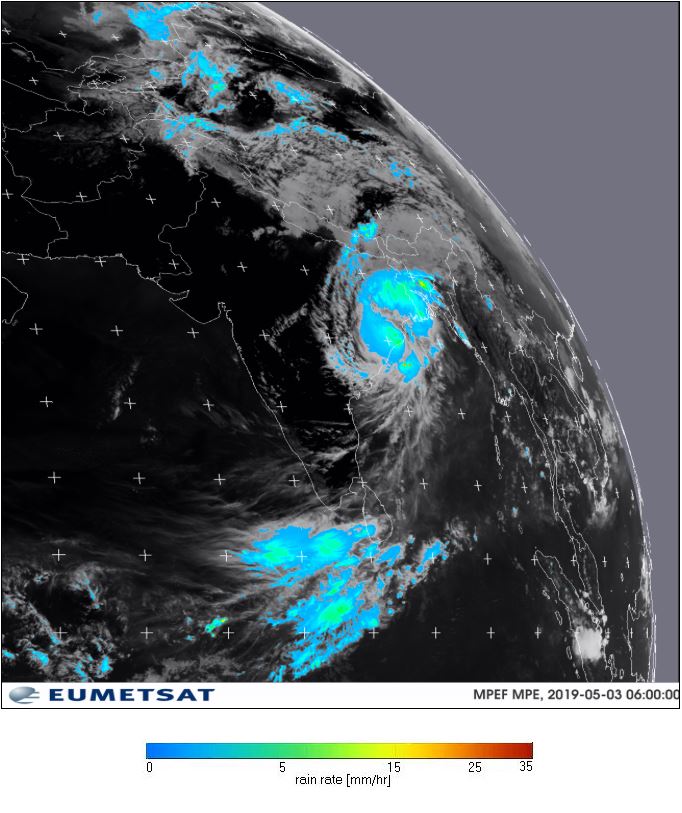
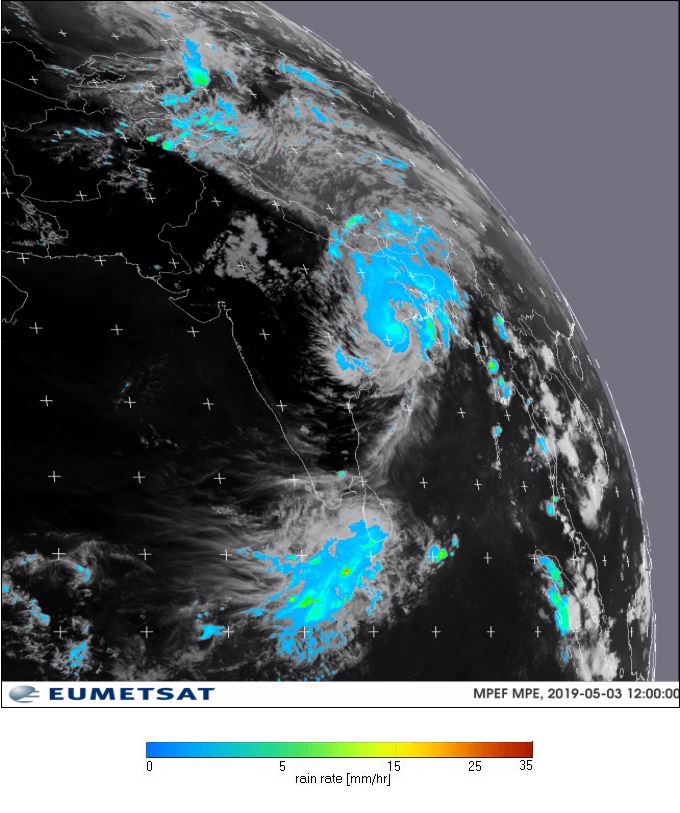
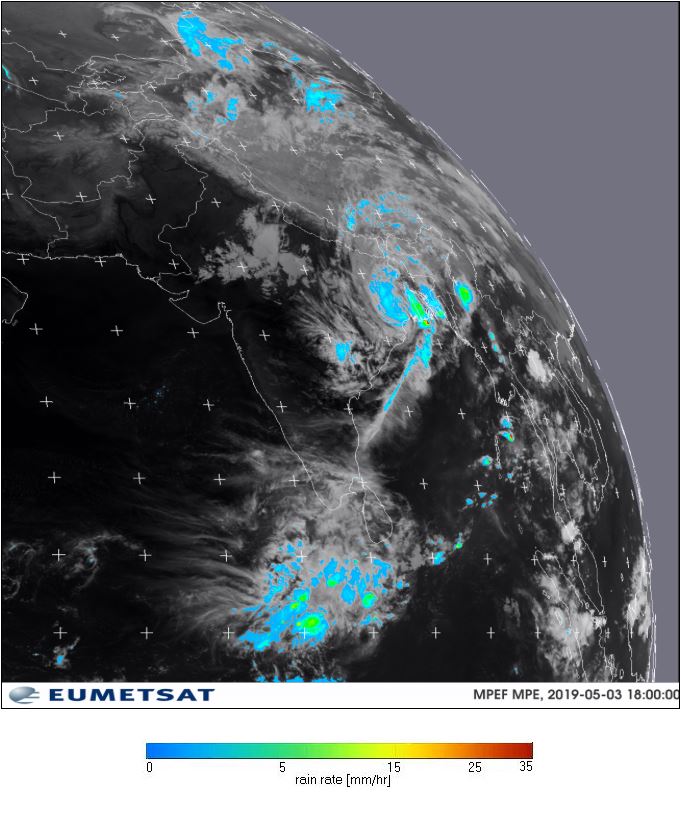
Cloud and rain formation Timelapse of FANI right before its landfall (satellite image with thermal overlay). Very cold cloud tops visible, especially east west of the eye, indicating a large C-shaped central dense overcast (short: CDO) around the storm's eye. data source: Eumetsat As indicated in the thermal overlay above, most intense precipitation occurred west of the eye. After FANI made landfall, precipation almost exclusivly occured on the western half of the storm. Whereas west of the eye, mountains of up to 1500 m height in the Indian states of Odisha and West Bengal as well as in Bangladesh provided heavy orographic precipitation of up to 279 mm/24h.
Measurements and Aftermath The Joint Typhoon Warning Center indicated 3-minute mean winds of up to 185 kph for FANI. The highest measured 10-minute mean winds were recorded by the station Digha on May 3 at 06 UTC, i.e. a few hours after land fall, with 159 kph. In the city of Cuttack (600,000 inhabitants) 128 mm precipitation were measured from 03 May 03 UTC to 04 May 03 UTC. Because of the storm, many ports on the east coast of India remained closed. There was damage to the power grid and restrictions on air traffic. Masts were overturned, roofs were ripped off or houses completely destroyed and cars whirled around. Intense rain led to floodings and landslides. At least 35 people were killed.
Data source: Ogimet Cars whirled around due to heavy winds (left) and falling crane (right). Source: Severe Weather Europe Text: FS May 05th, 2019 |
|||||||||||||||||||||||||||||||||||||||||||