|
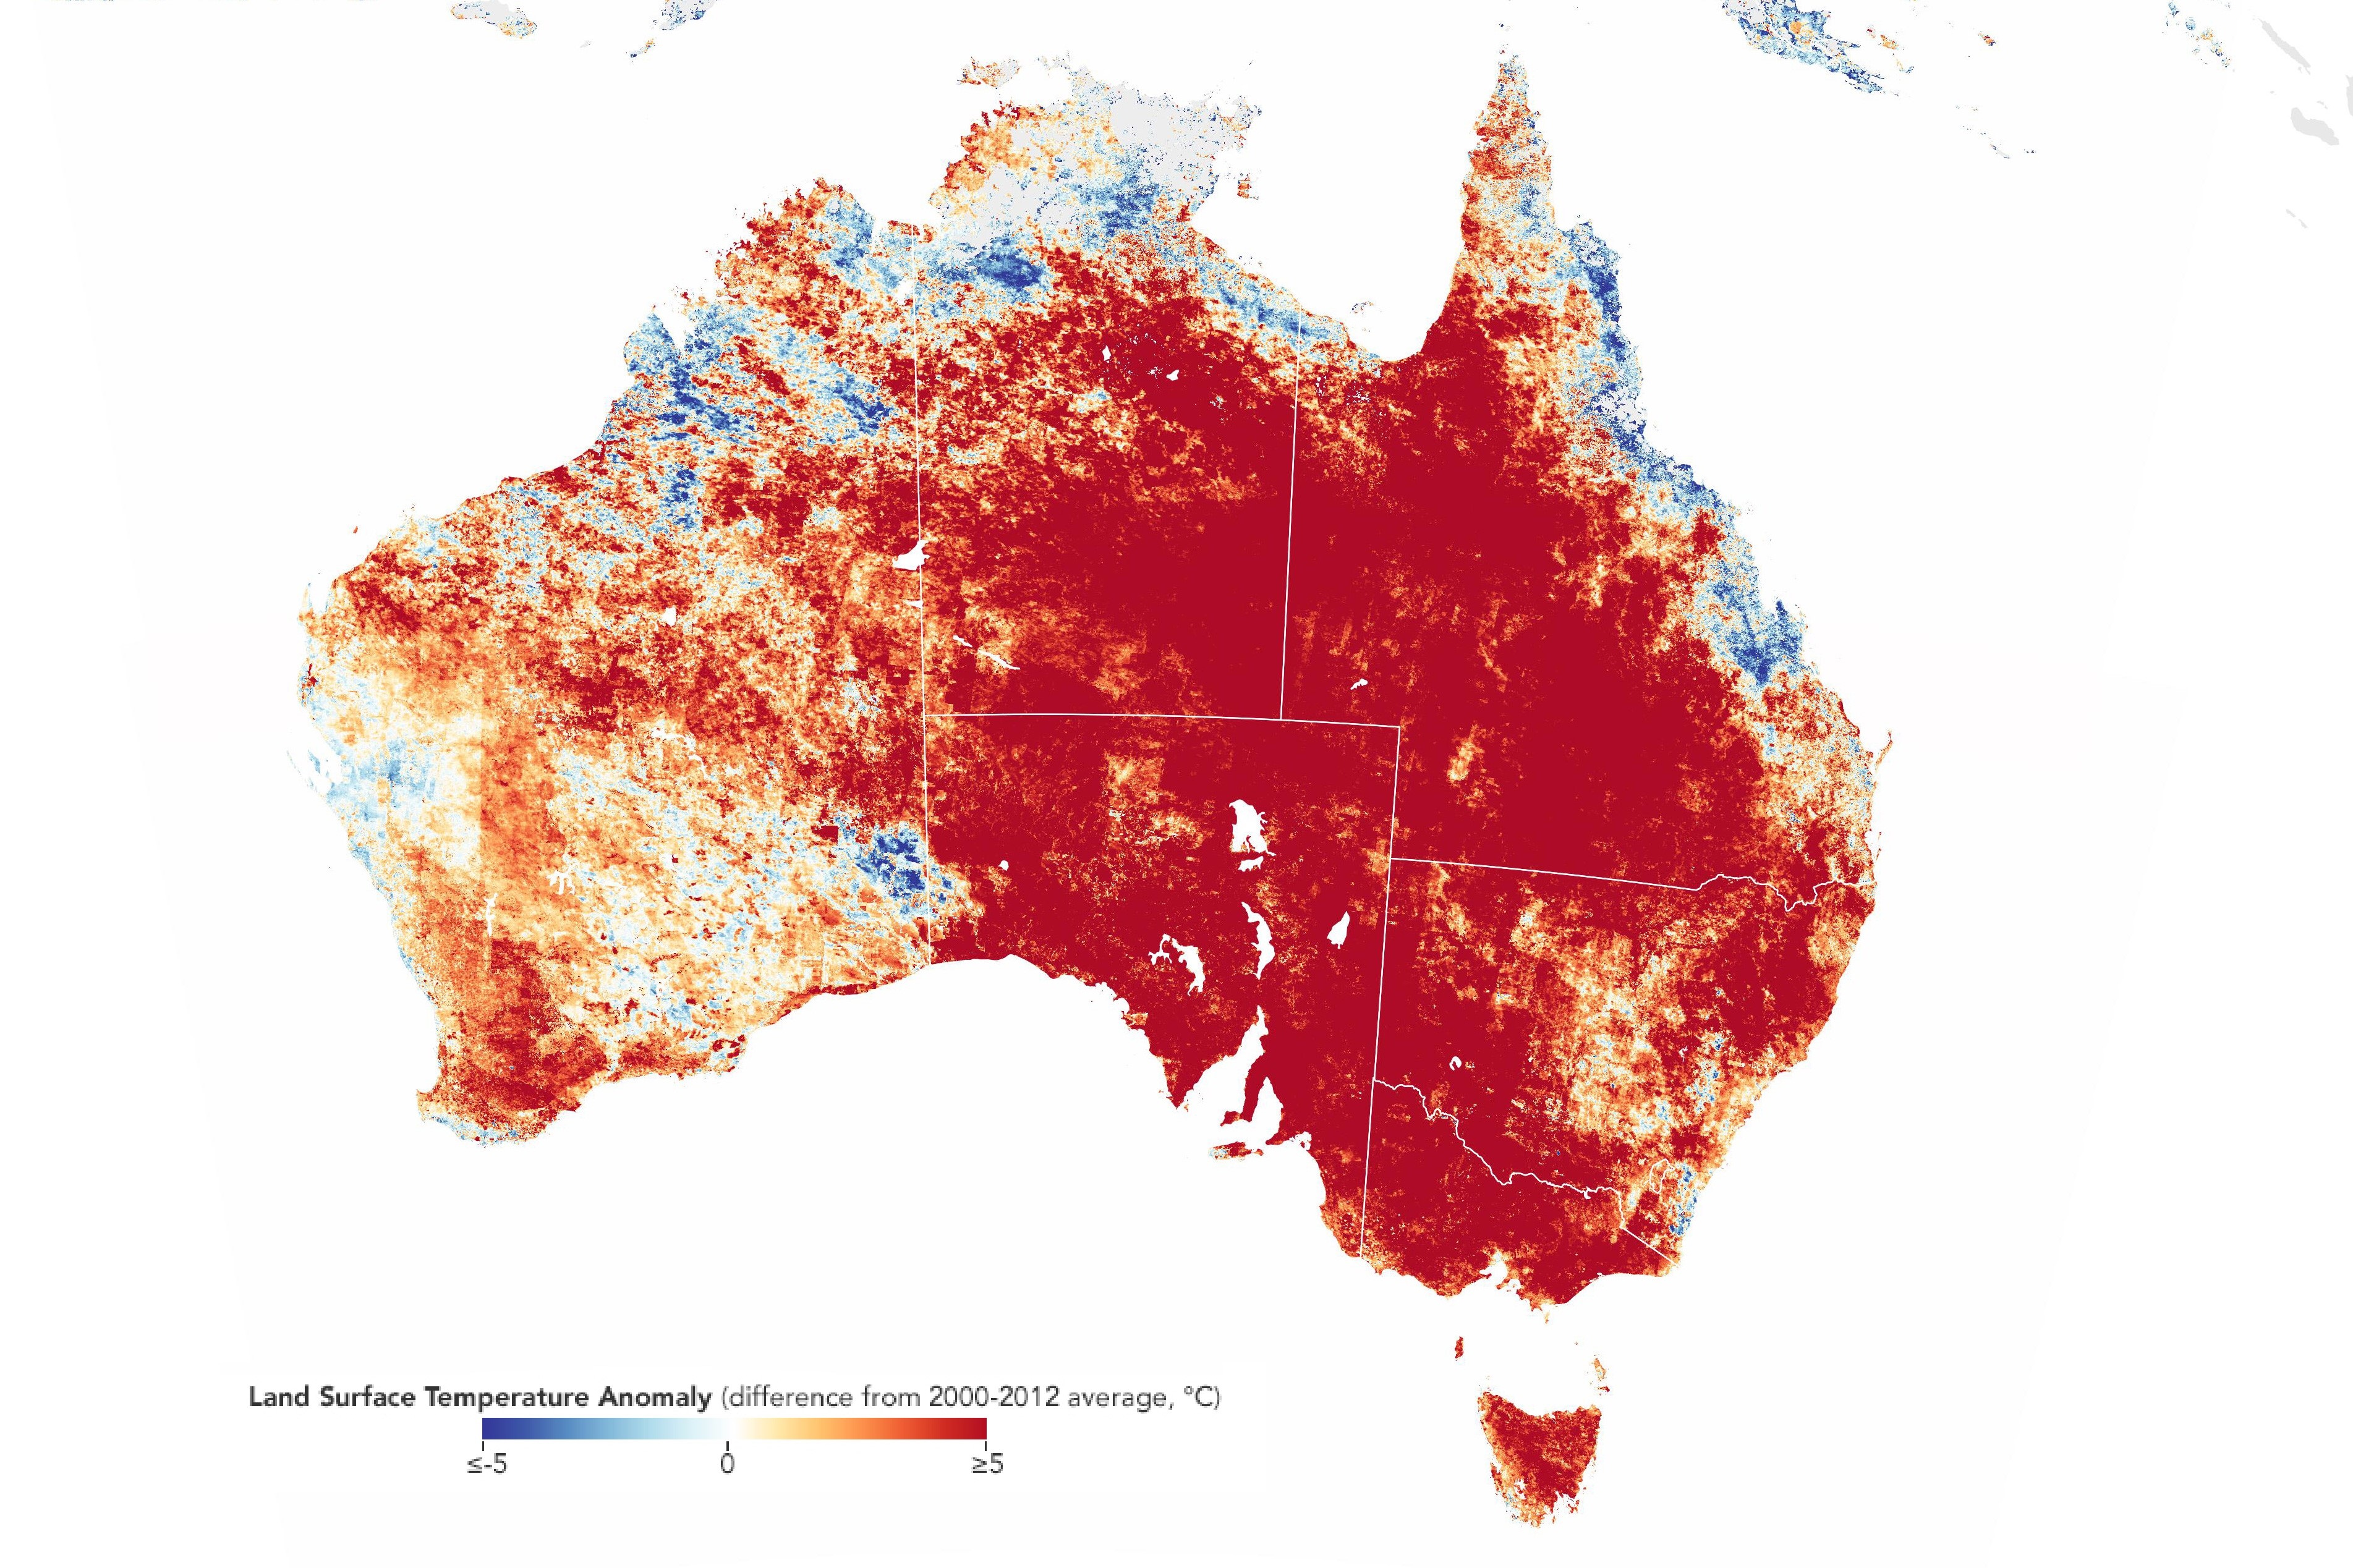
In Australia, a pronounced heat wave began in December 2018 and continued into January 2019. The spatial average daily maximum temperature
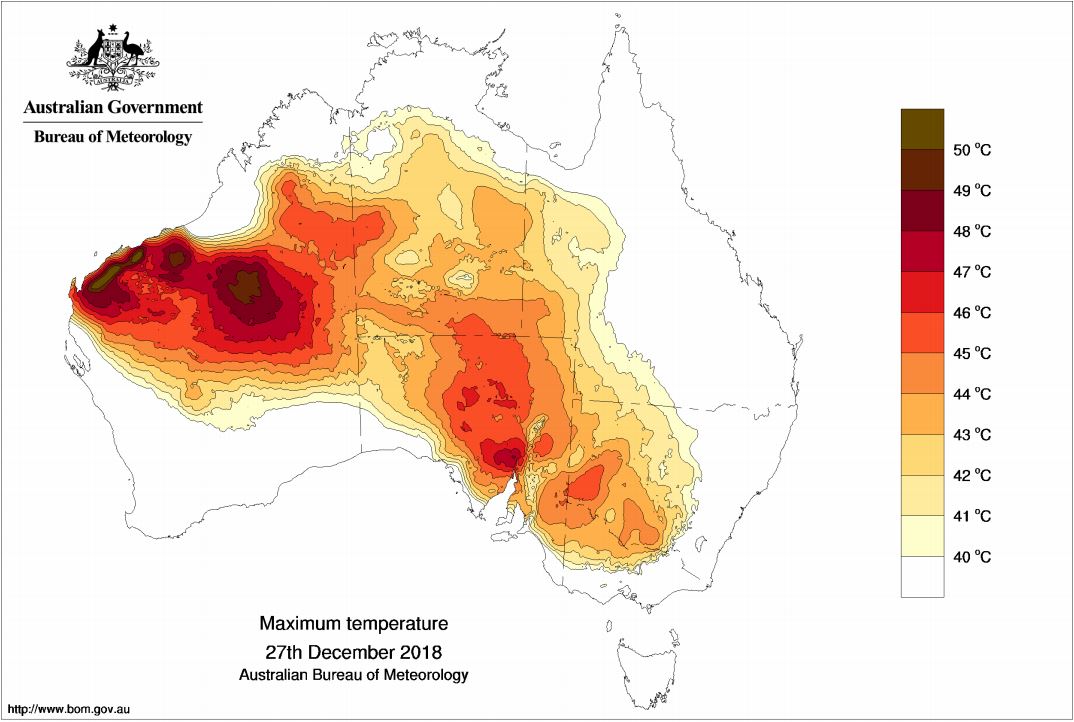
on 27 December was the highest for the month December. The average daily maximum temperature
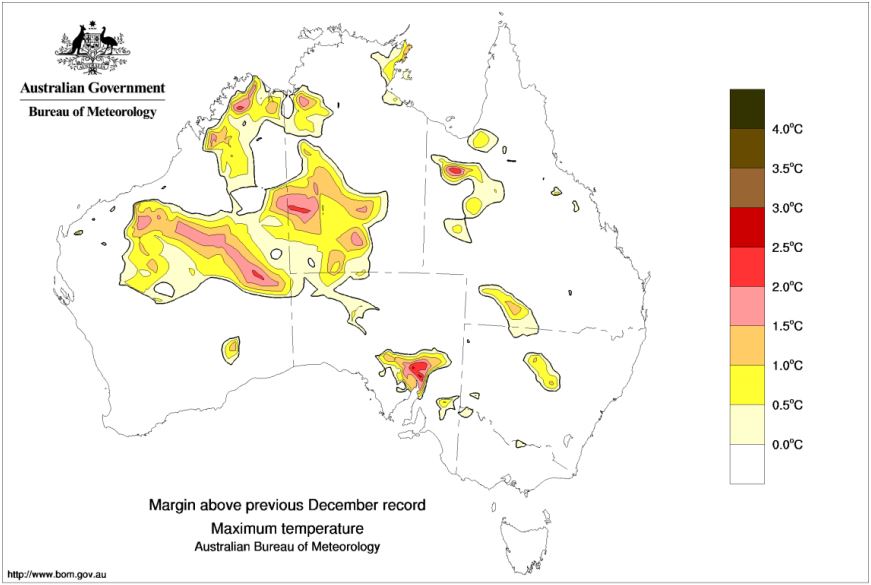
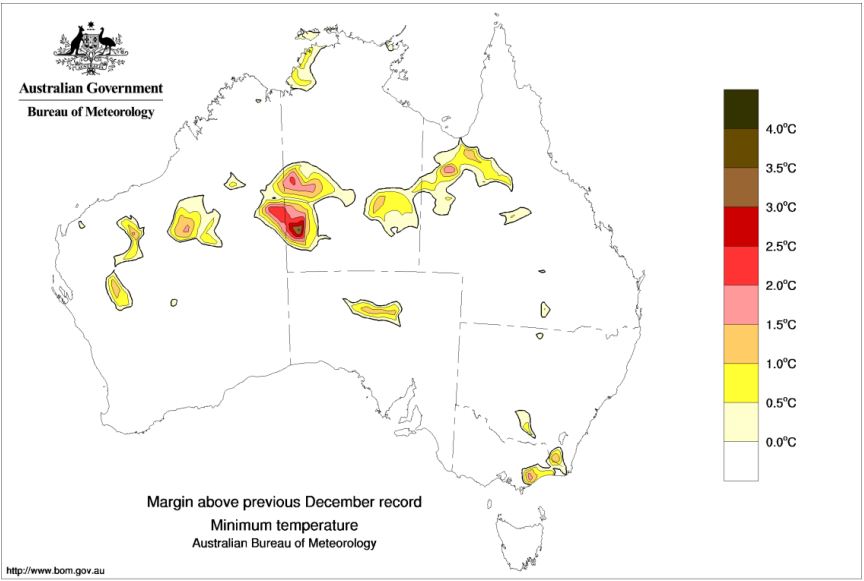
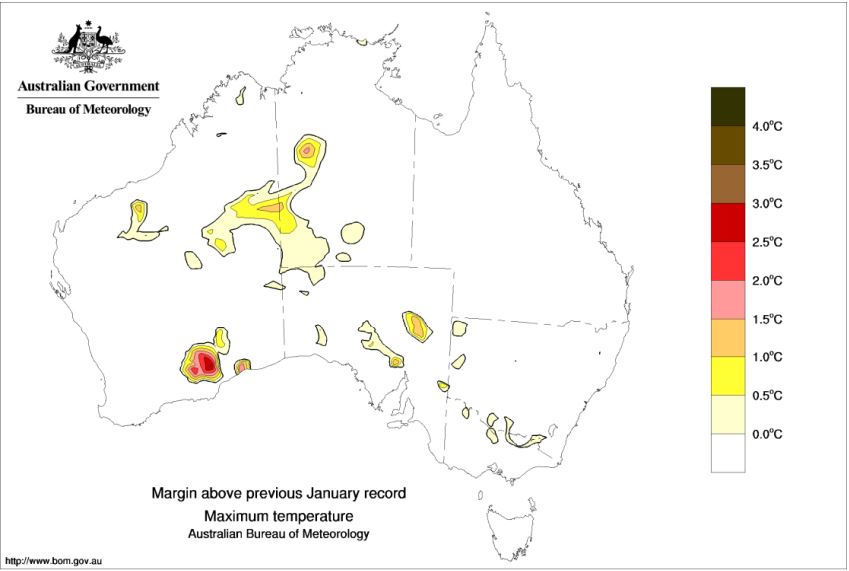
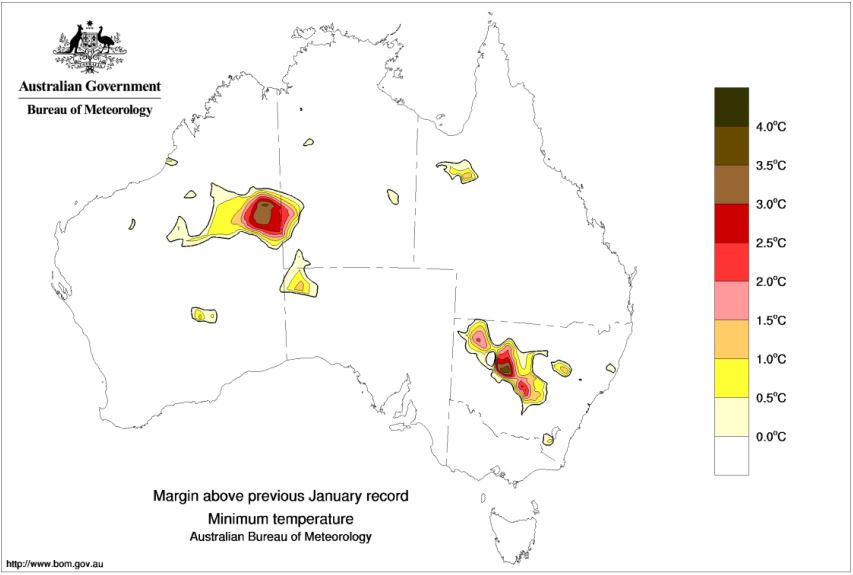
of 15 January was even the second highest of all times. New records of the daily maximum temperature were set at countless stations.
Overall, December 2018 was the warmest December ever in Australia, just as January 2019 was the warmest January ever.
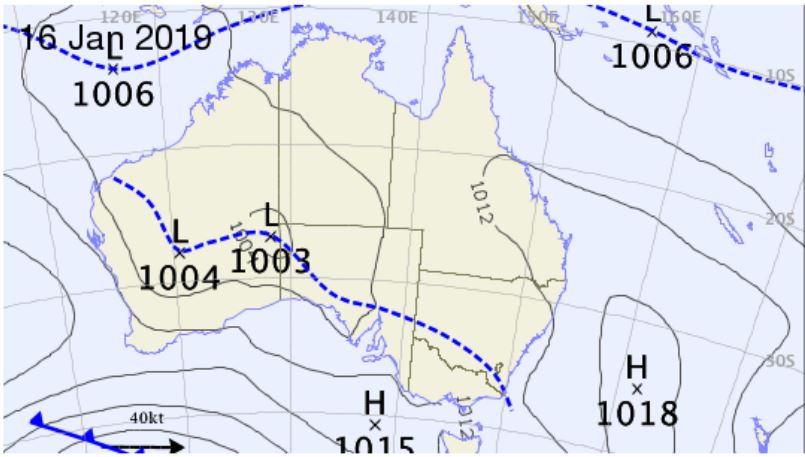
Development of the persistent heat wave
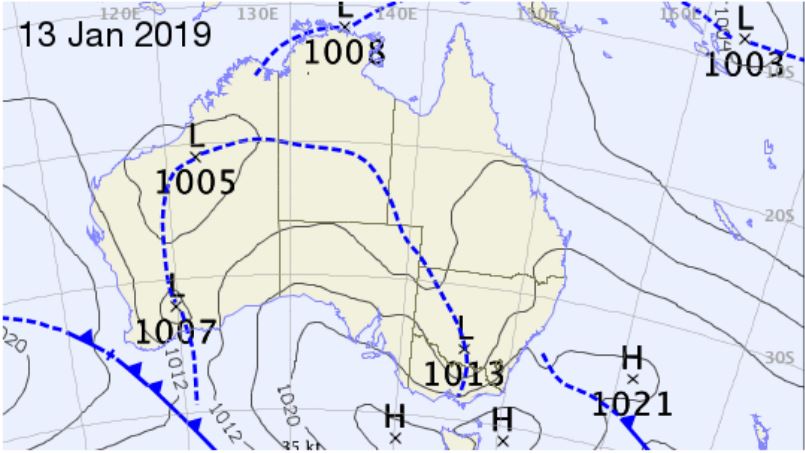
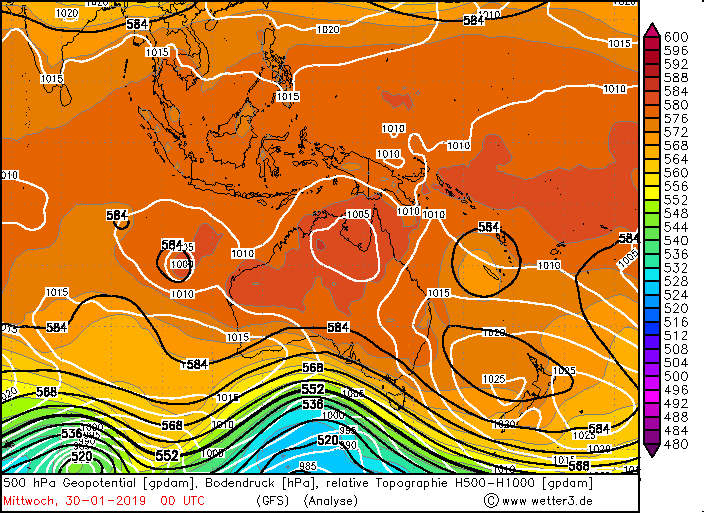
A strong heat depression over the western part of Australia and the propagation of troughs from west to east across Australia caused
northwesterly winds, periodically dragging hot air east and south across the Northern Territory, South Australia, Western Queensland,
New South Wales and Victoria. The heat wave reached a maximum intensity in two periods. The first on was around 29 December 2018
and the second one around 15 January 2019.
27 December
With an average maximum temperature of 40.19°C, 27 December was the warmest December day since weather recording.
With a western current extremely warm air masses were carried from the west of Australia to the south and southeast. This caused record
temperatures not only in the west, but also in the south and southeast. Even the cities of Mildure and Albury, located far to
the southeast, recorded maximum daily temperatures of over 40°C for consecutive days.
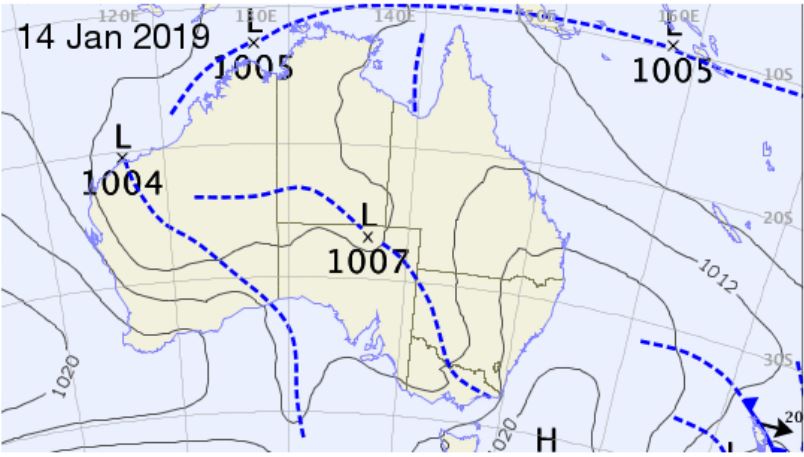
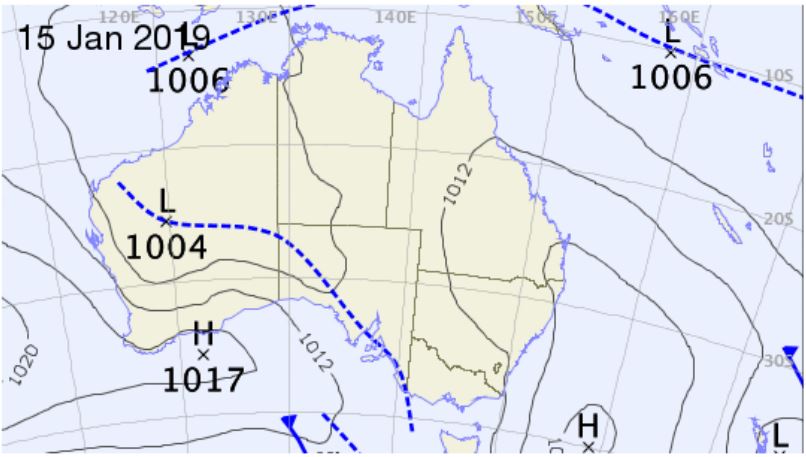
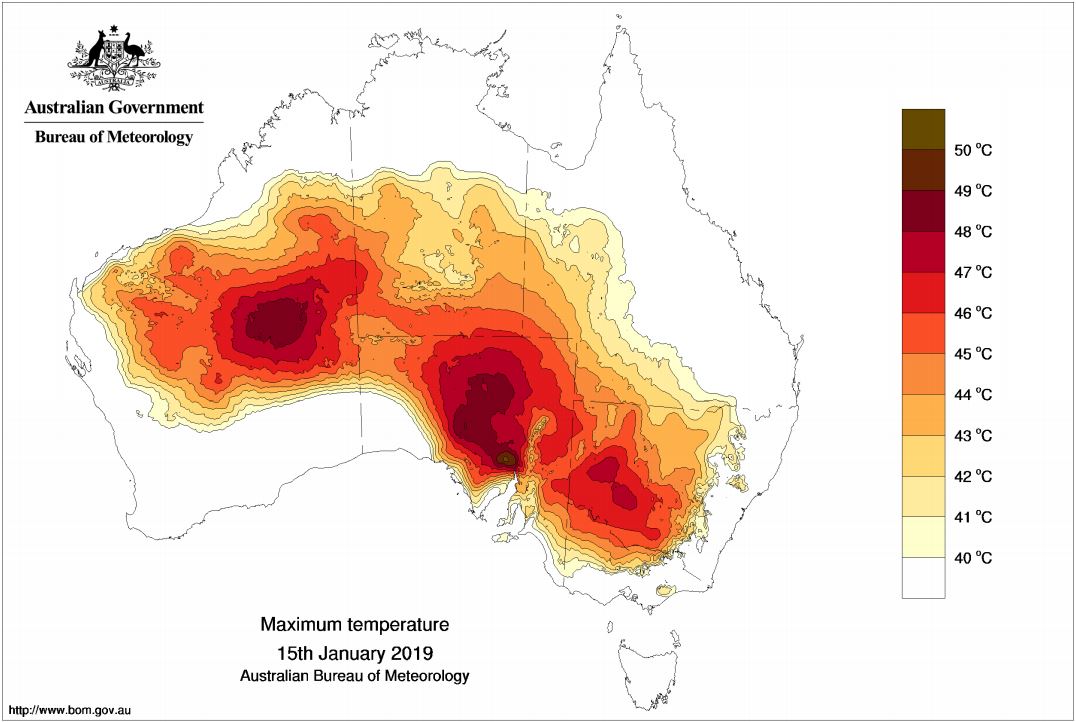
15 January
As the heat depression in Western Australia intensified again at the beginning of January 2019, a high pressure system over Tasmania caused
the heat to spread to the southeast due to northwesterly winds again. The heat wave peaked from 12 to 16 January with nationally average maximum temperature
of more than 40°C on each of these days.
New weather records
The biggest particularity of the heat wave was the temporal and spatial extension of the high temperatures.
As a result, 7 days of the current heat wave belong to the 10 days with the highest national mean Temperature since recording started.
New temperature records for Australia (spatial mean), data source: Australian Government Bureau of Meteorology
| Type of record |
Temperature in °C |
Date |
Maximum Temperature (December)
Minimum Temperature (general)
Mean Temperature (general)
|
40.21
25.09
32.63
|
27 Dec 2018
22 Jan 2019
22 Jan 2019
|
|
Although the heat wave has rather impressed by the temporal and spatial extent, new record temperatures have been set at innumerable stations.
The highest temperature of the heat wave is 49.3°C, registered on 27 December at Marble's Bar. It's only 0.2°C lower than the highest
ever recorded temperature in December, 49.5°C on 24 December 1972 in Birdsville.
New monthly temperature records for individual locations, data source: Australian Government Bureau of Meteorology
| Location |
Temperature in °C |
Date |
Marble Bar (WA)
Wittenoom (WA)
Rabbit Flat (NT)
Curtin Springs (NT)
Port Pirie (SA)
Alice Springs (NT)
Tarcoola (SA)
Port Augusta (SA)
Coober Peddy (SA)
Yulara (NT)
Norseman (WA)
Griffith (NSW)
West Wyalong (NSW)
|
49.3
47.8
47.1
46.9
46.6
45.6
49.0
48.9
47.8
46.8
46.5
46.4
46.3
|
27 Dec 2018
27 Dec 2018
12 and 19 Dec 2018
30 Dec 2018
28 Dec 2018
29 Dec 2018
15 Jan 2019
15 Jan 2019
16 Jan 2019
03 Jan 2019
13 Jan 2019
16 Jan 2019
17 Jan 2019
|
|
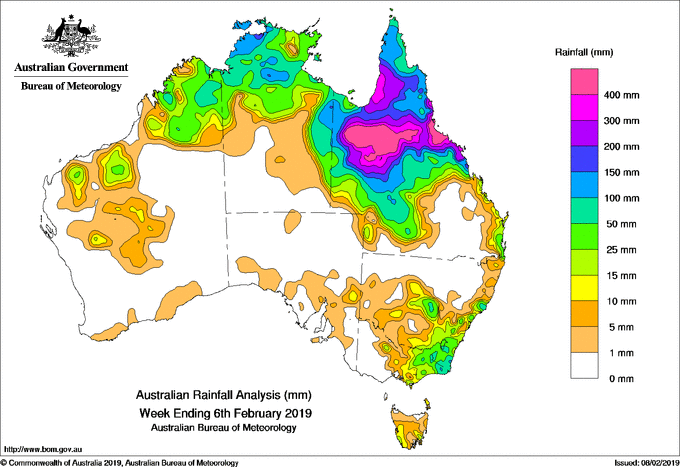
Heavy precipitation and flooding
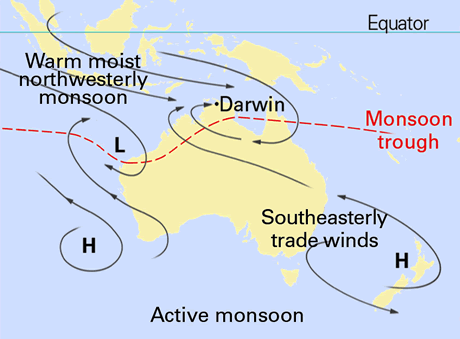
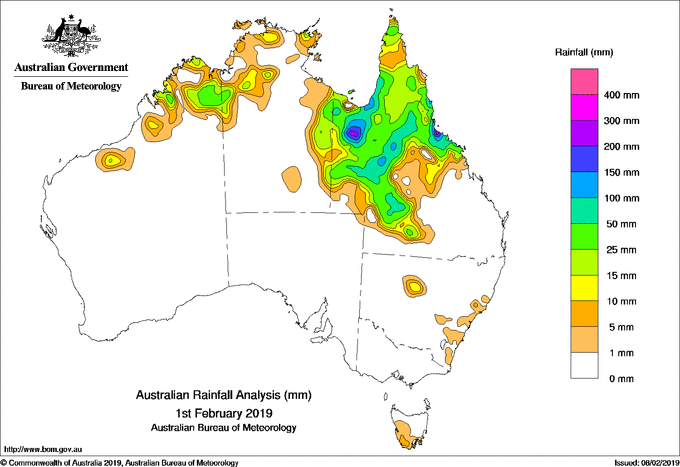
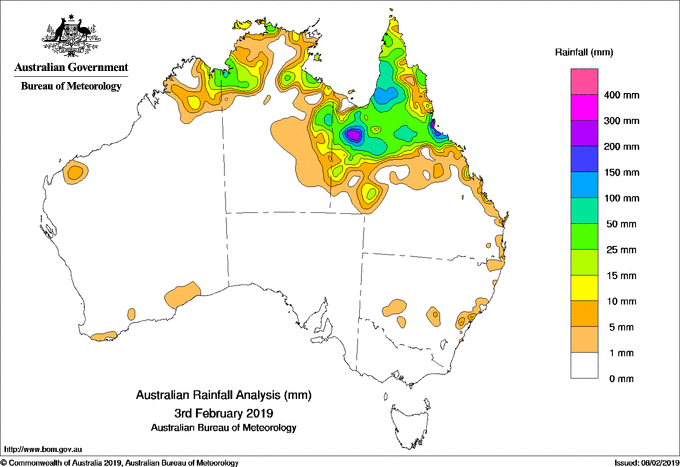
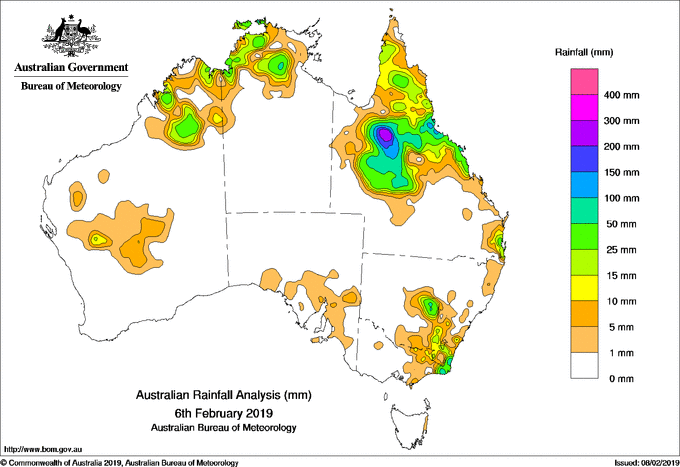
In the last third of January, a monsoon trough developed out of an impulse of the Madden
Julian Oscillation over Queensland.Towards the end of the month a synoptic situation occurred,
which allowed and favoured the development of the monsoon, so that the monsoon trough
intensified and moved south, generating enormous amounts of rainfall immediately.
With the Madden Julian Oscillation moving further eastwards, the Monsoon trough established over Northeastern Australia in the first days of February
and reached from a deep tropical low near Mt. Isa in northwestern Queensland, to another tropical low located in the Coral Sea.
Due to the absence of movement and the enormous intensity of the Monsoon Trough, many weather stations recorded more than 100 mm of precipitation per day
over a period of more than a week. There have been periods when the rainfall rates exceeded 100 mm/h which caused heavy flash floodings.
168h-Precipitation (7 days) from 01 to 07 February (selection), data source: Australian Government Bureau of Meteorology
| Location |
Precipitation in mm |
Woolshed
Paluma Ivy Cottage
Mutarnee Store
Ingham Pump Station AL
Rollingstone
Mount Stuart (Defence)
Yabulu QLD Nickel
Victoria Sugar Mill
Townsville Aero
Ingham Composite
Gairloch
Macknade Sugar Mill
Bambaroo
|
1289.6
1271.0
1065.0
944.0
931.0
927.8
904.5
886.2
880.2
872.4
869.2
844.0
801.4
|
|
Text: FS
08 Feb, 2019
|