|
Friday, 10th May 2016, 19:30 MESZ
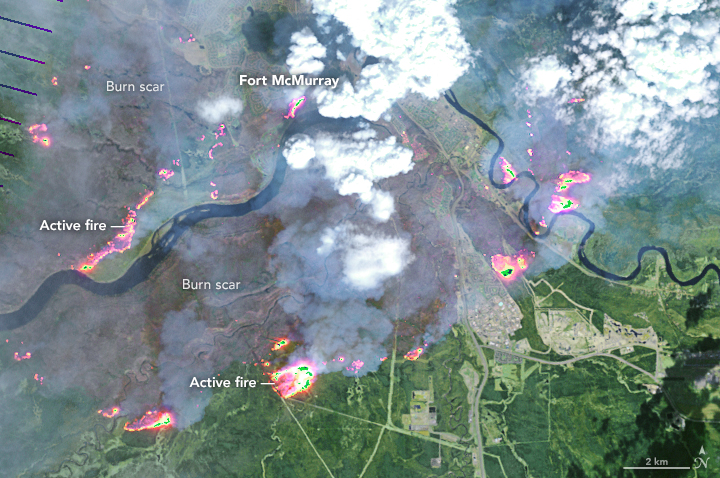
Wildfire Canada May 2016 Wildfires on May 4th, 2016 in Fort McMurray Source: NASA |
|
|
At the begginning of May 2016 devastating forest fires developed around Fort McMurray in Alberta, Canada. The wildfires spread over a space of 1.600 square kilometers, which is about half the space of Rhode Island (smallest State in the USA). 90.000 people had to flee and be evacuated in a dangerous rescue operation – the biggest evacuation from wildfires in the history of the province of Alberta. For the first time in the history of North America, a city with at least 60.000 inhabitants was surrounded by severe wildfires. At least two people died during the evacuation and more than 1.600 buildings were destroyed in Fort McMurray. In the district Waterways around 90 % of the buildings were destroyed. The resulting damage this far is estimated to be above nine billion Canadian dollars (6,1 billion Euros).
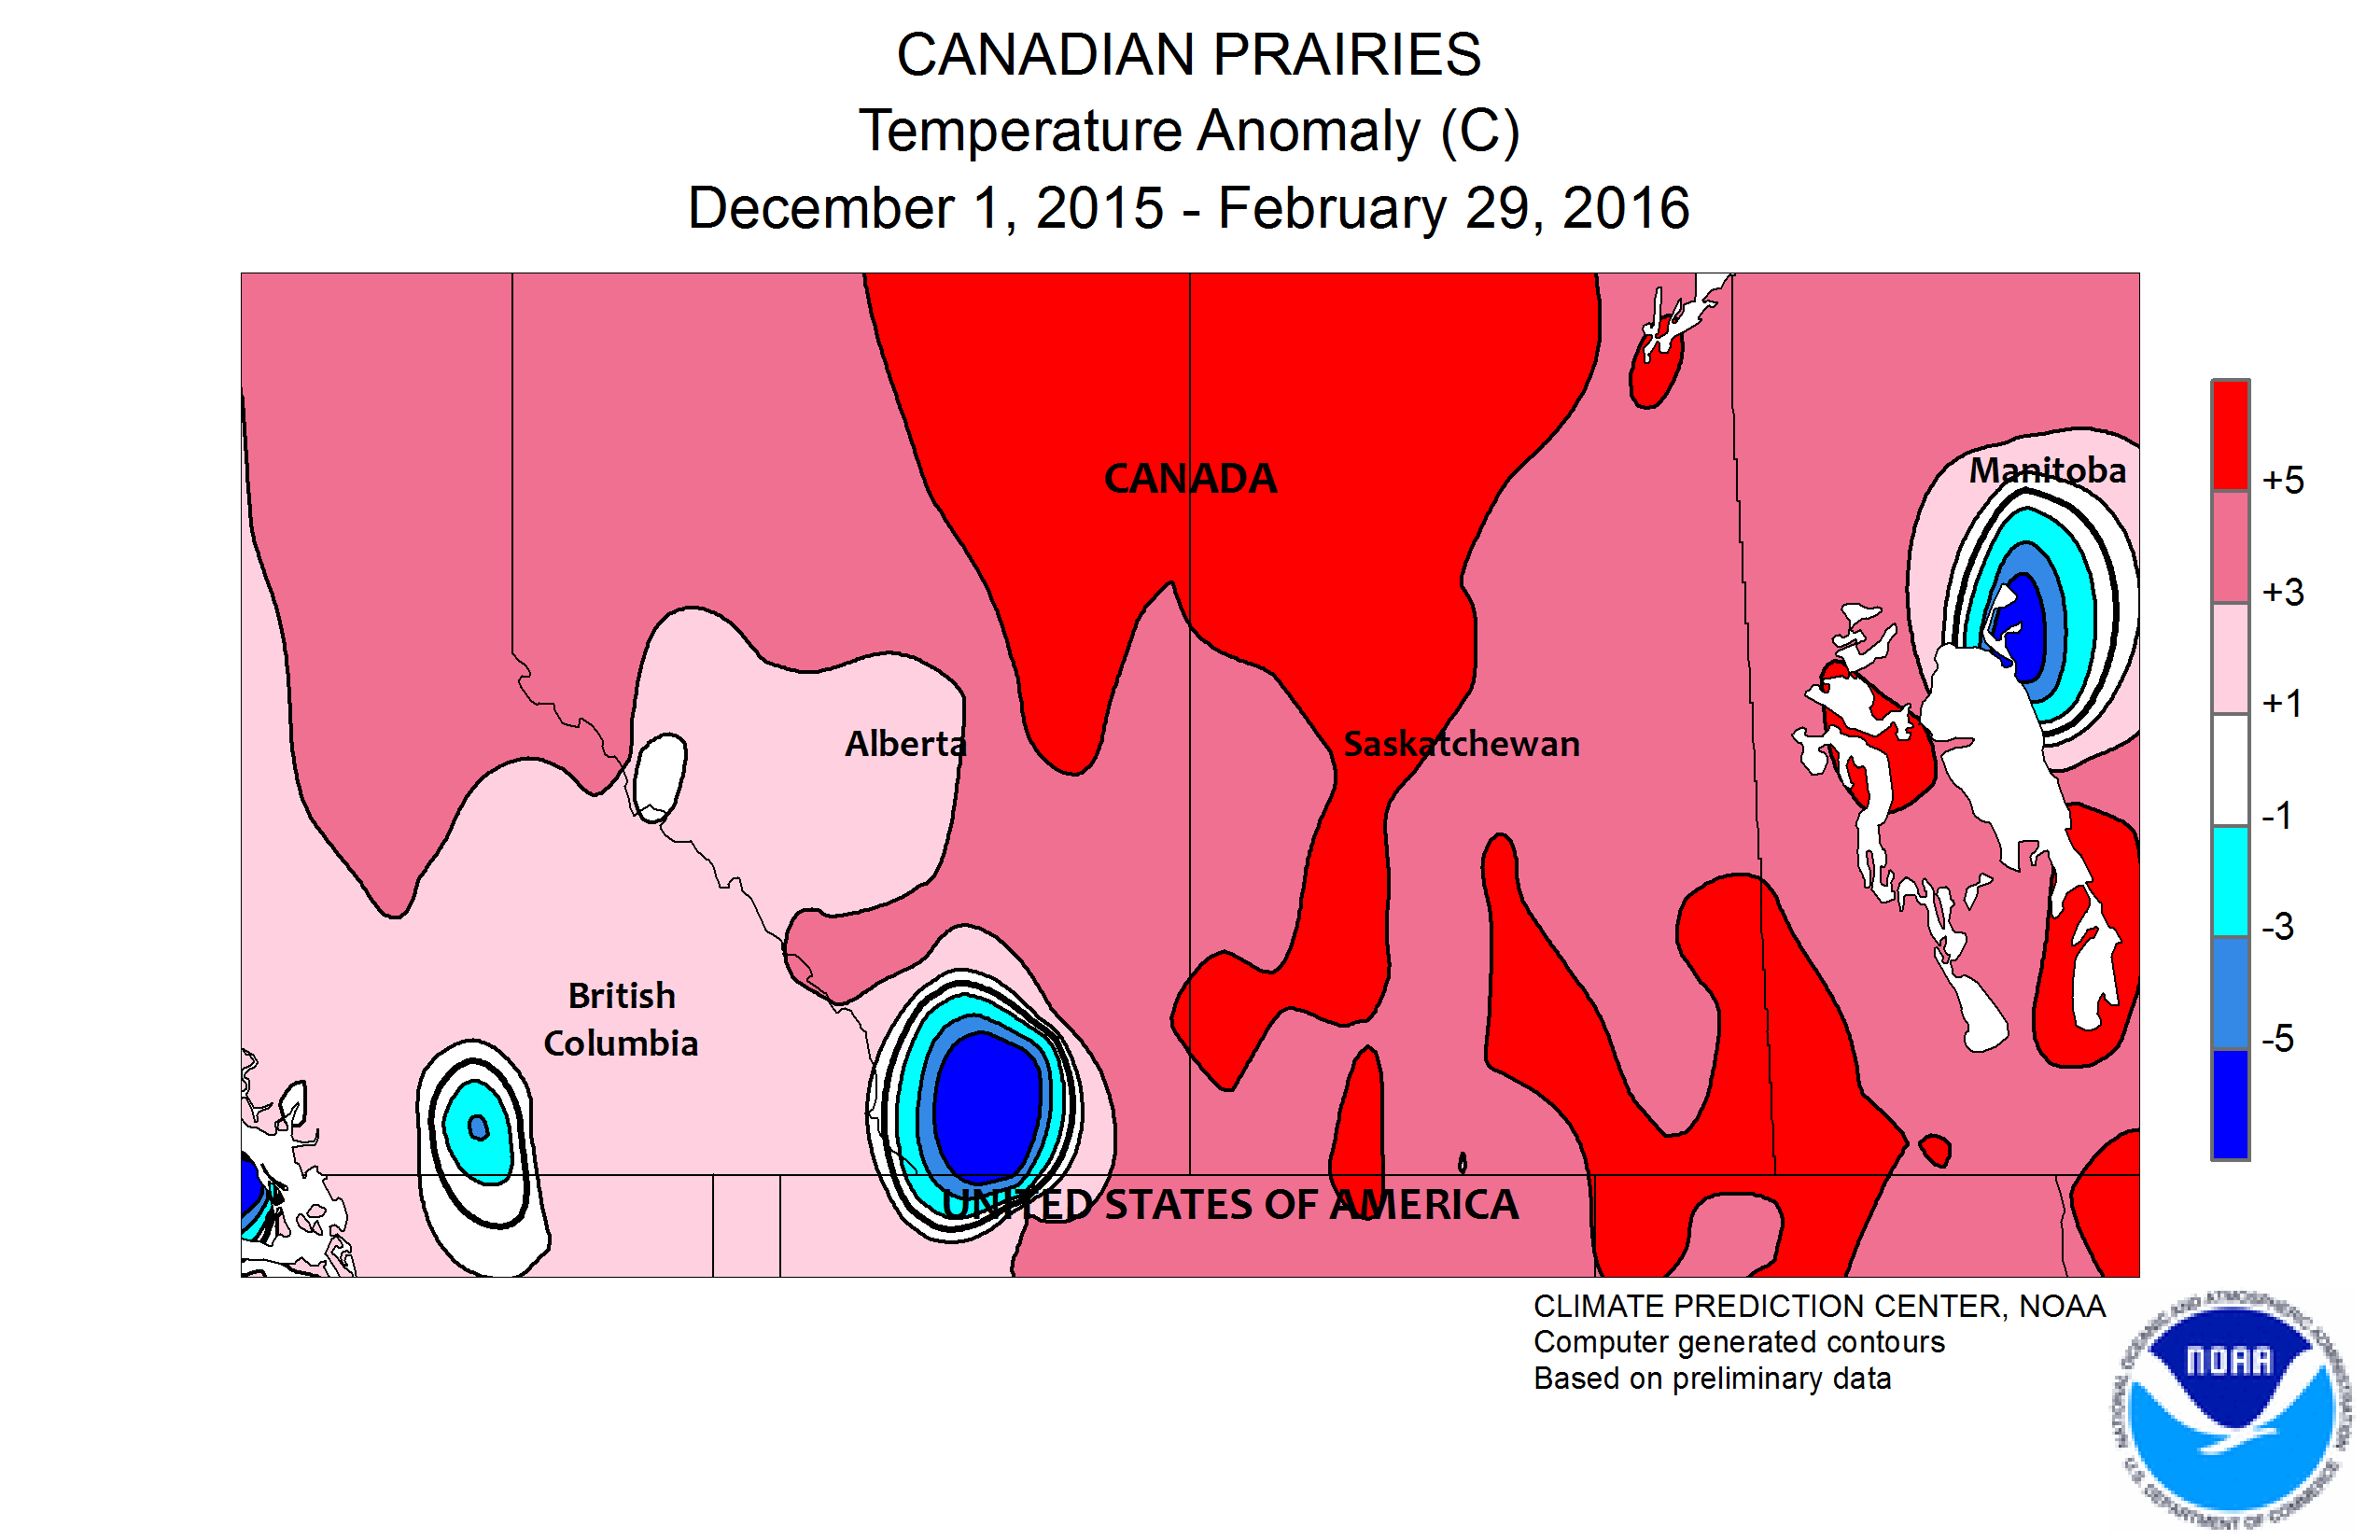
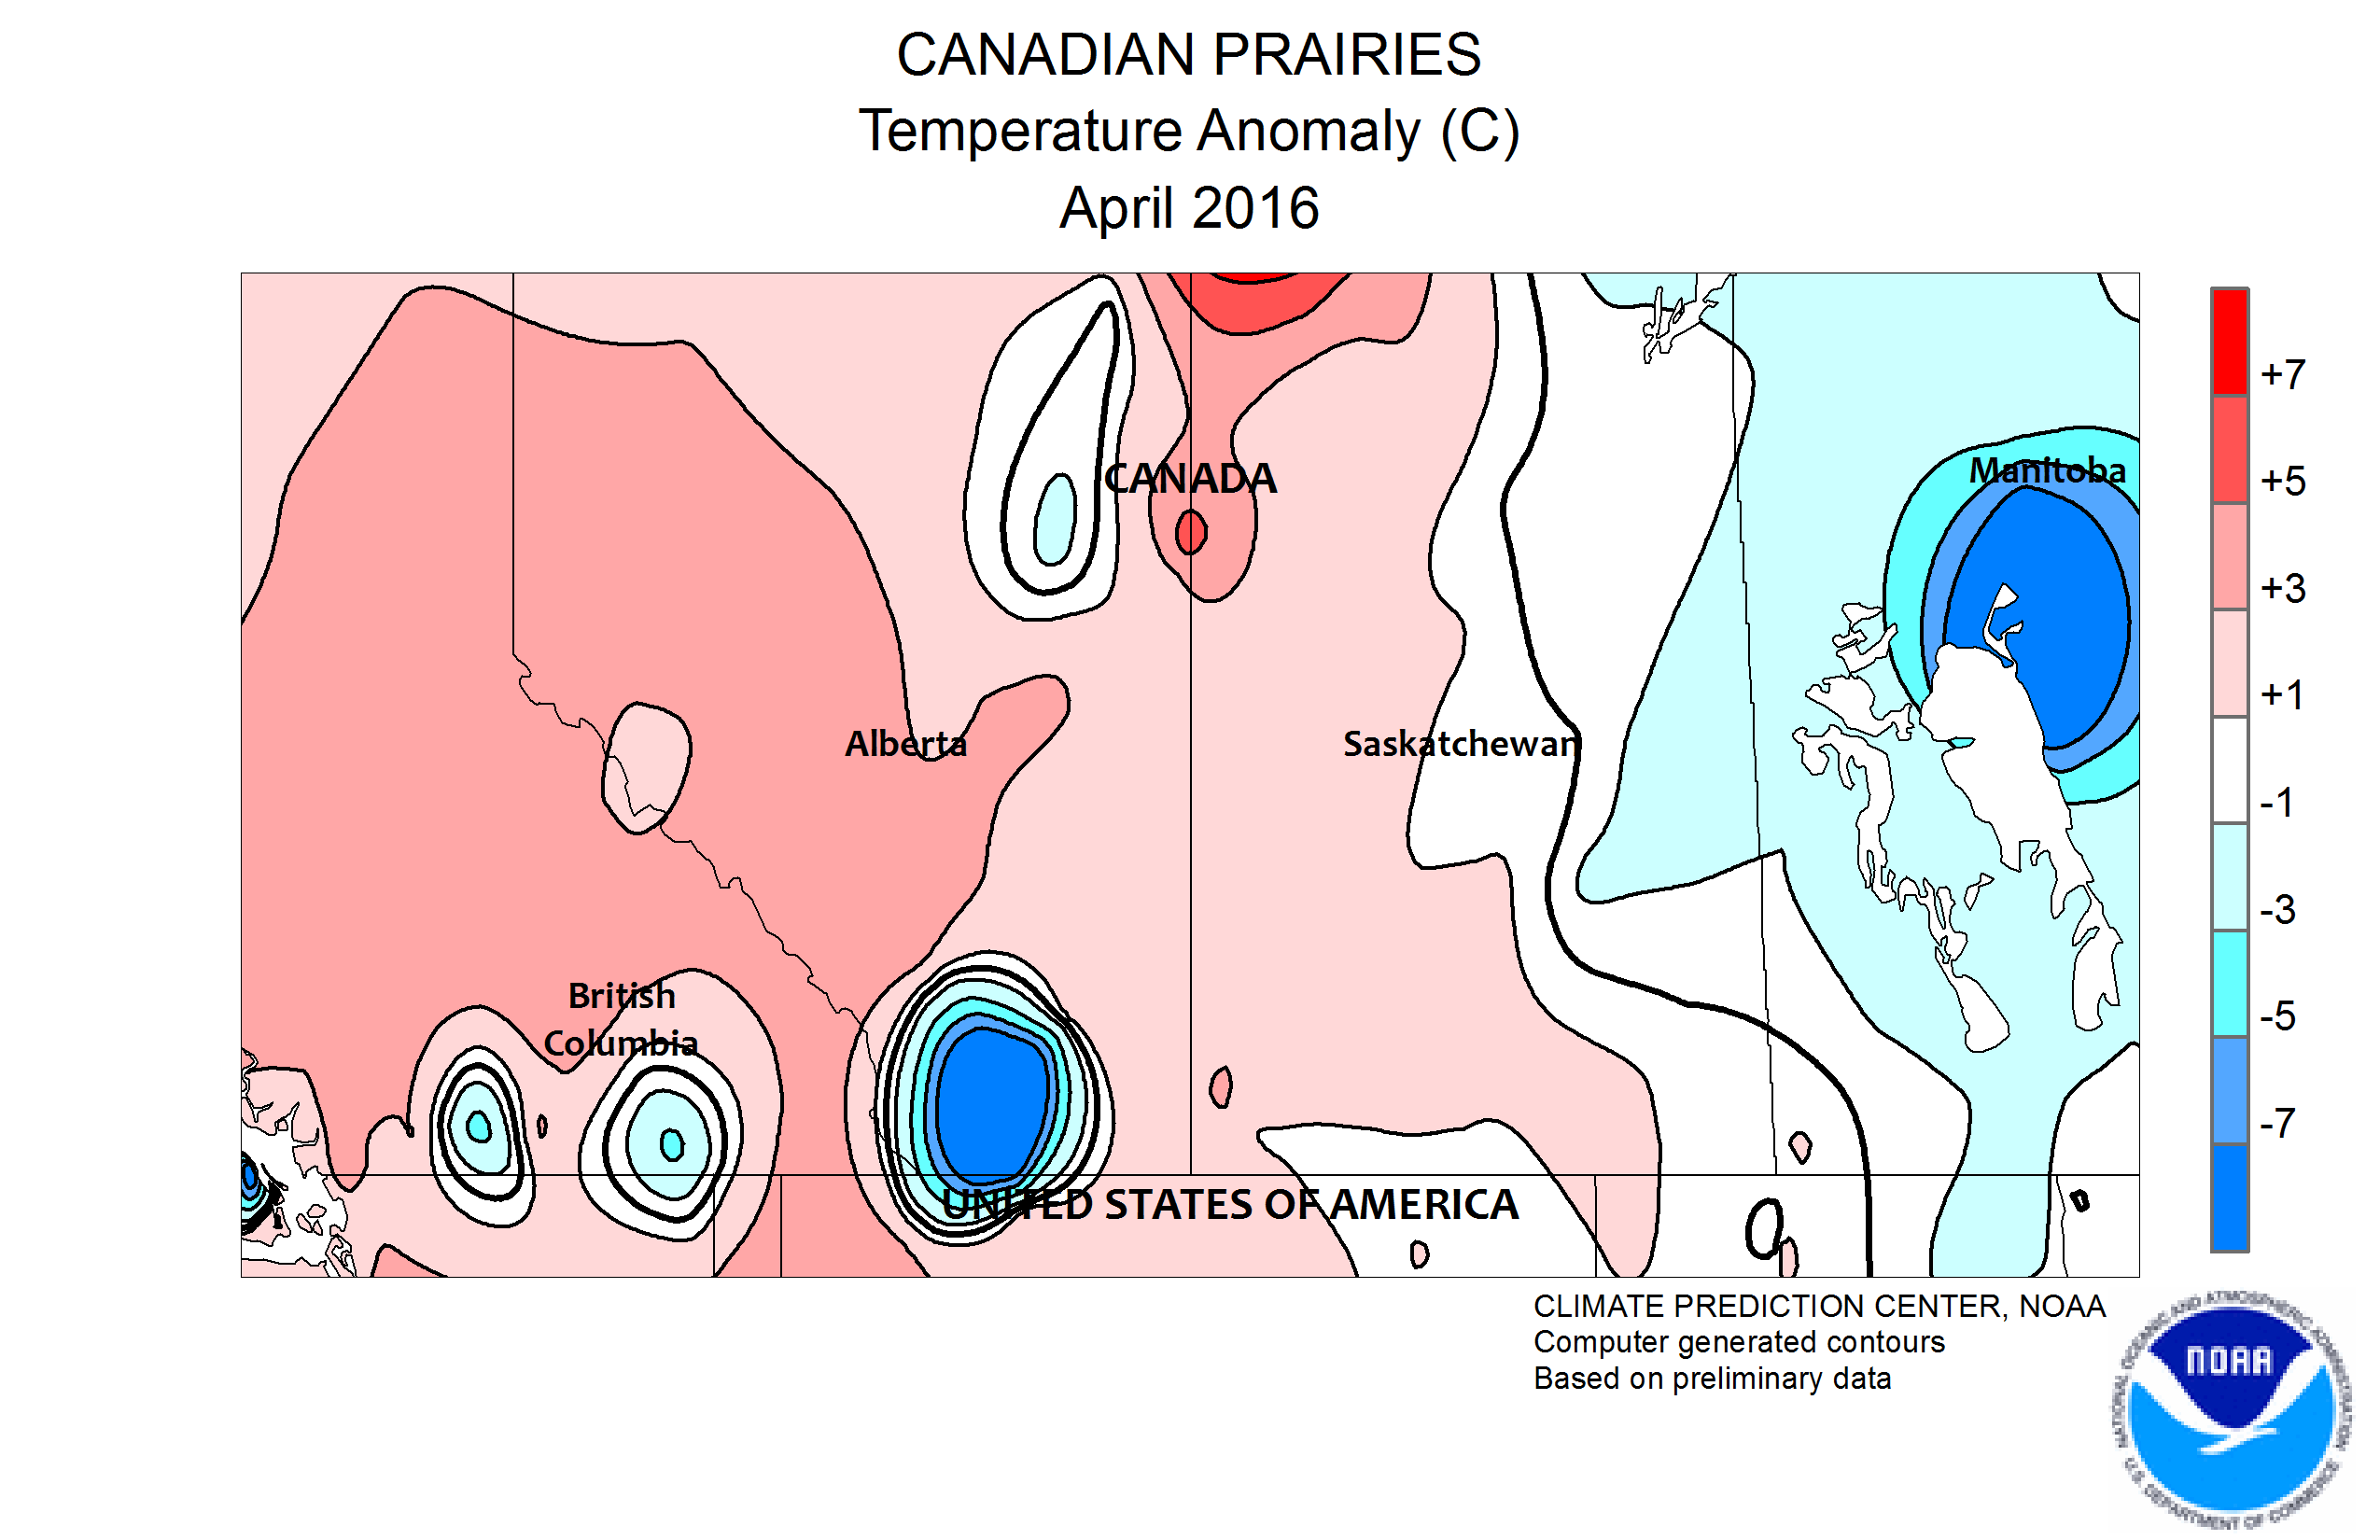
Development in North America Over the last months a strong El Niño was observed in the Pacific. Usually, an El Niño has resulted in a wet winter over the south of California. In Polar Regions (i.e. Canada) El Niño winters tend to be warmer because of the northward shifted Jetstream. In general, temperatures in the Arctic were too high throughout the whole winter (5 K). Currently, the observed sea ice cover is at 11.78 Mio km² which is about 1 Mio km² lower than at the same time in 2012. In that year, the lowest sea ice cover ever after the summer months was measured on the 18th of September (3.18 Mio km²). The carbondioxid (CO2) concentration and correlated global temperature are on a all time high for months (over 408 ppm; 1.5 K warmer than the preindustrial period in February). For an El Niño it is not typical that this year February was the warmest ever recorded in Los Angeles (USA). Further north, Seattle recorded the wettest winter since the beginning of the record. A recovery of the snow situation in the Sierra Nevada at the end of last year followed a four year long drought. Over the last months, a ridge established over the western North American continent and resulted in high temperatures. The consequence was the warmest April since the beginning of the record in Northwest America.
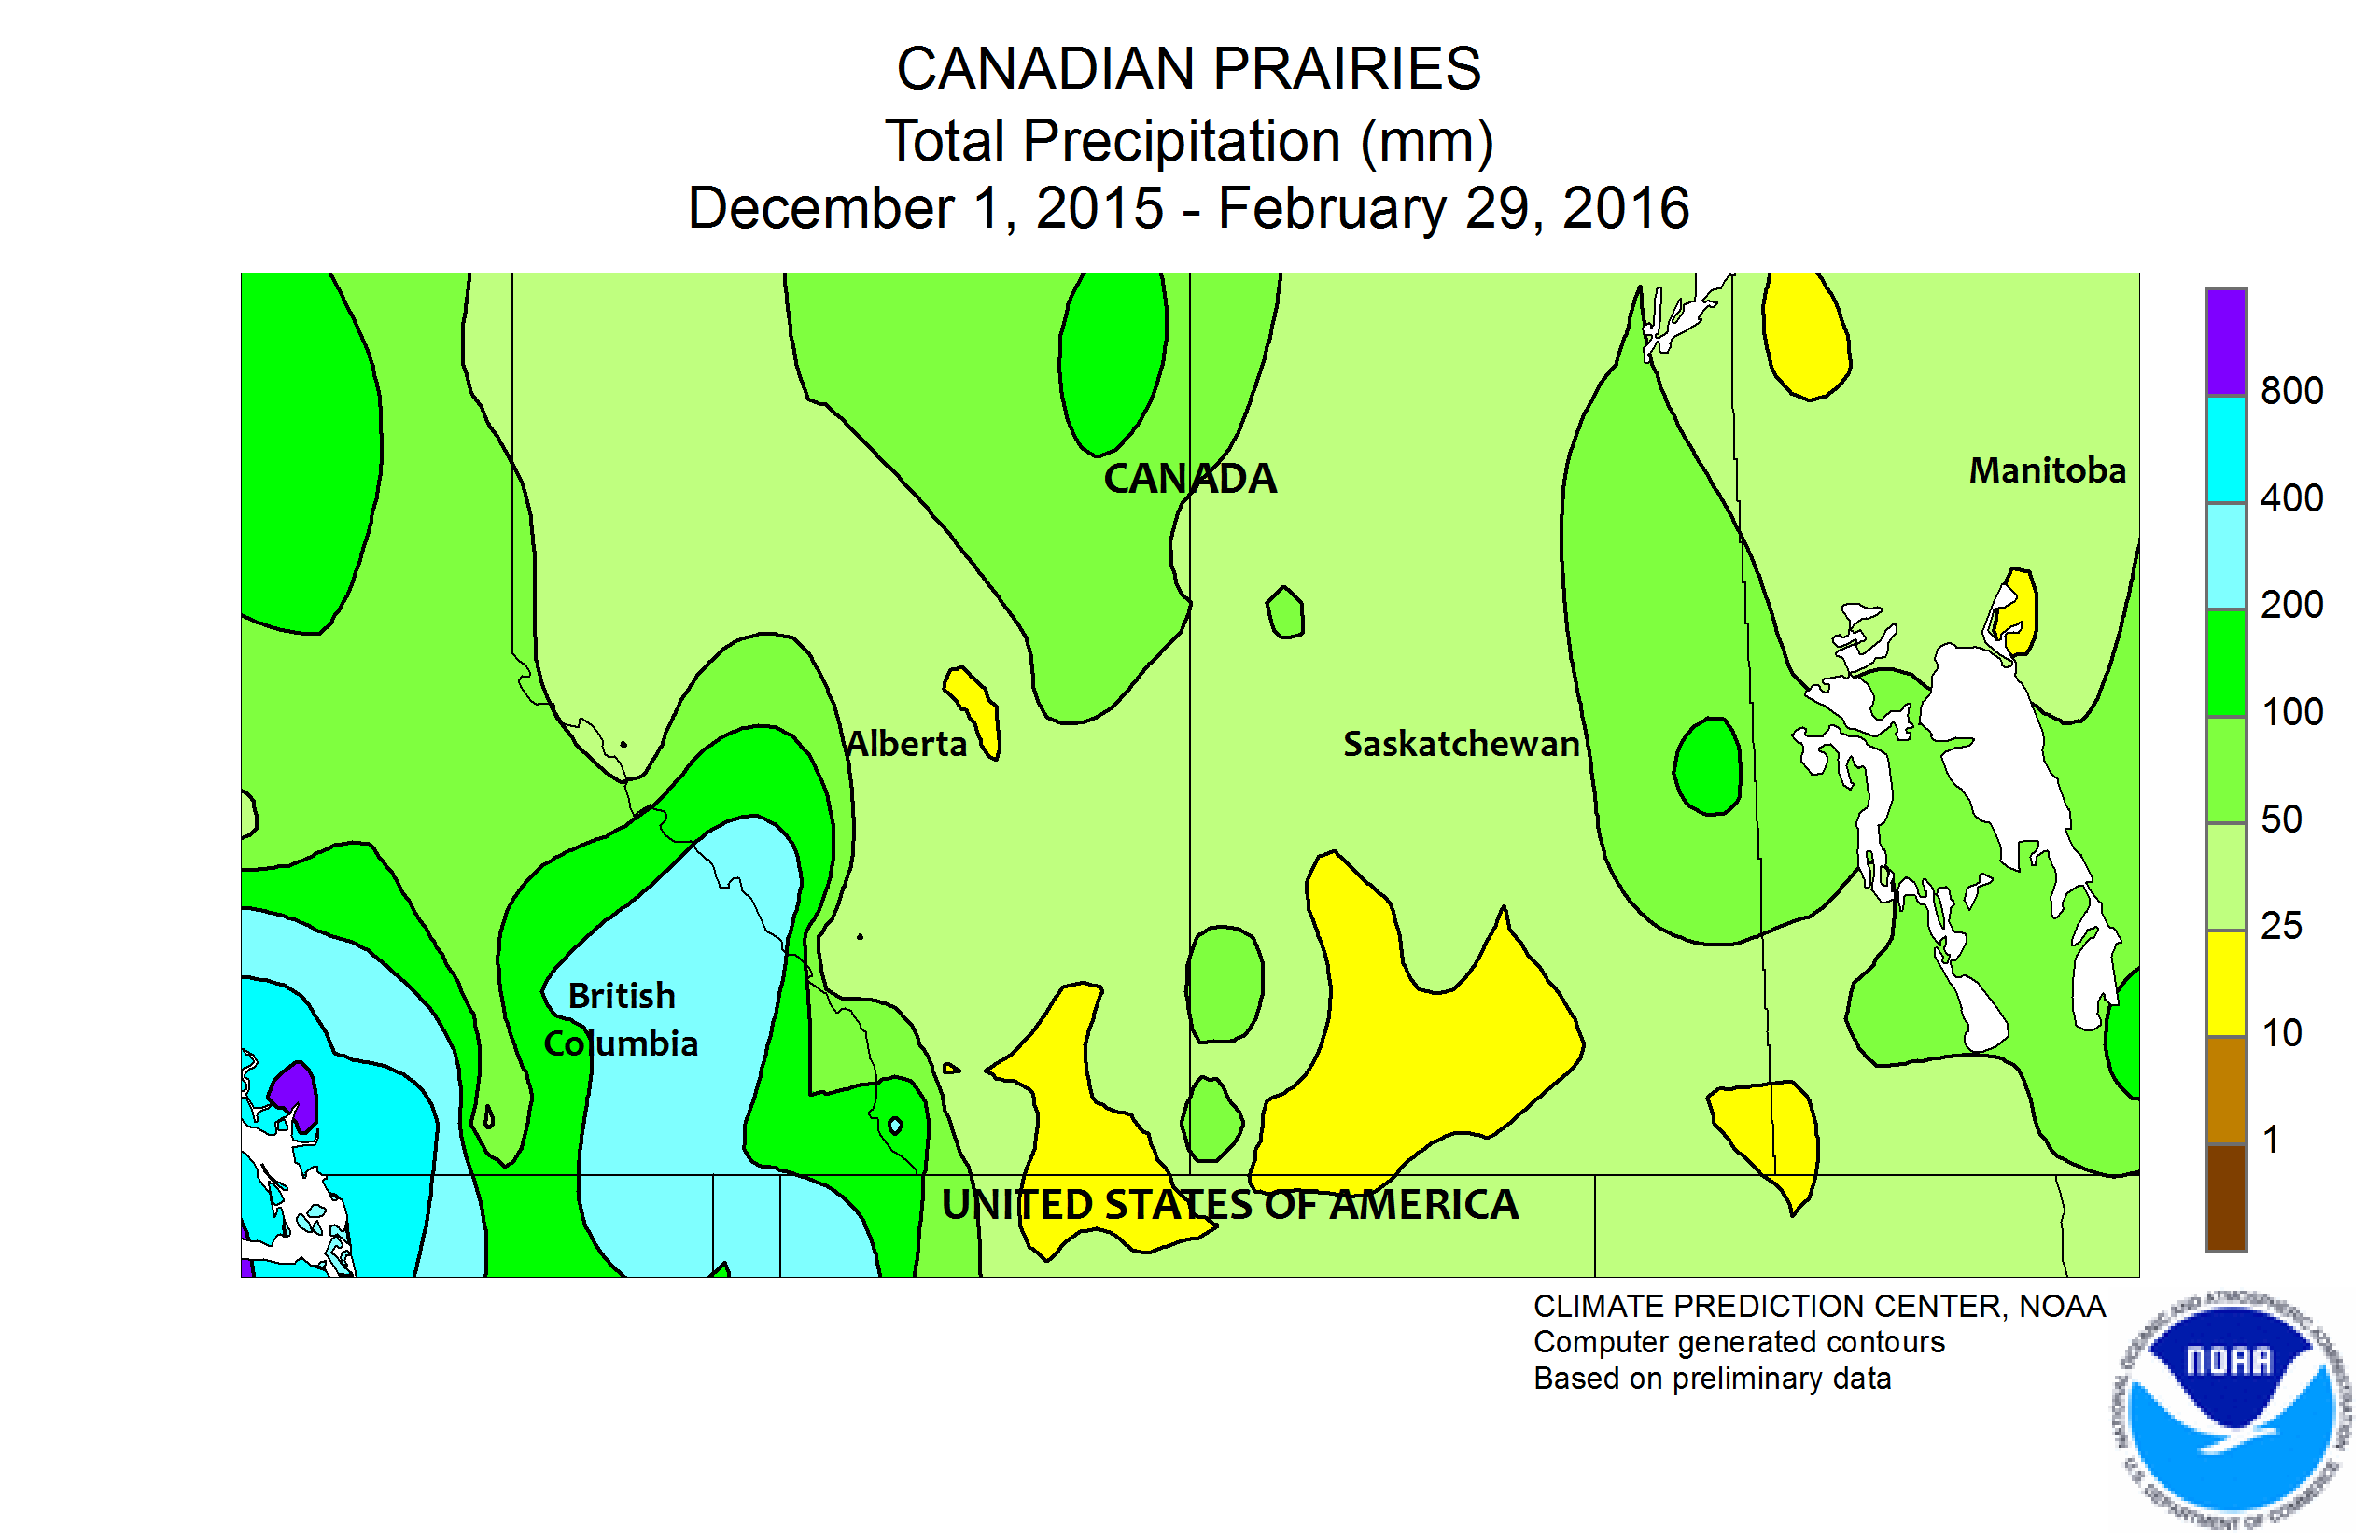
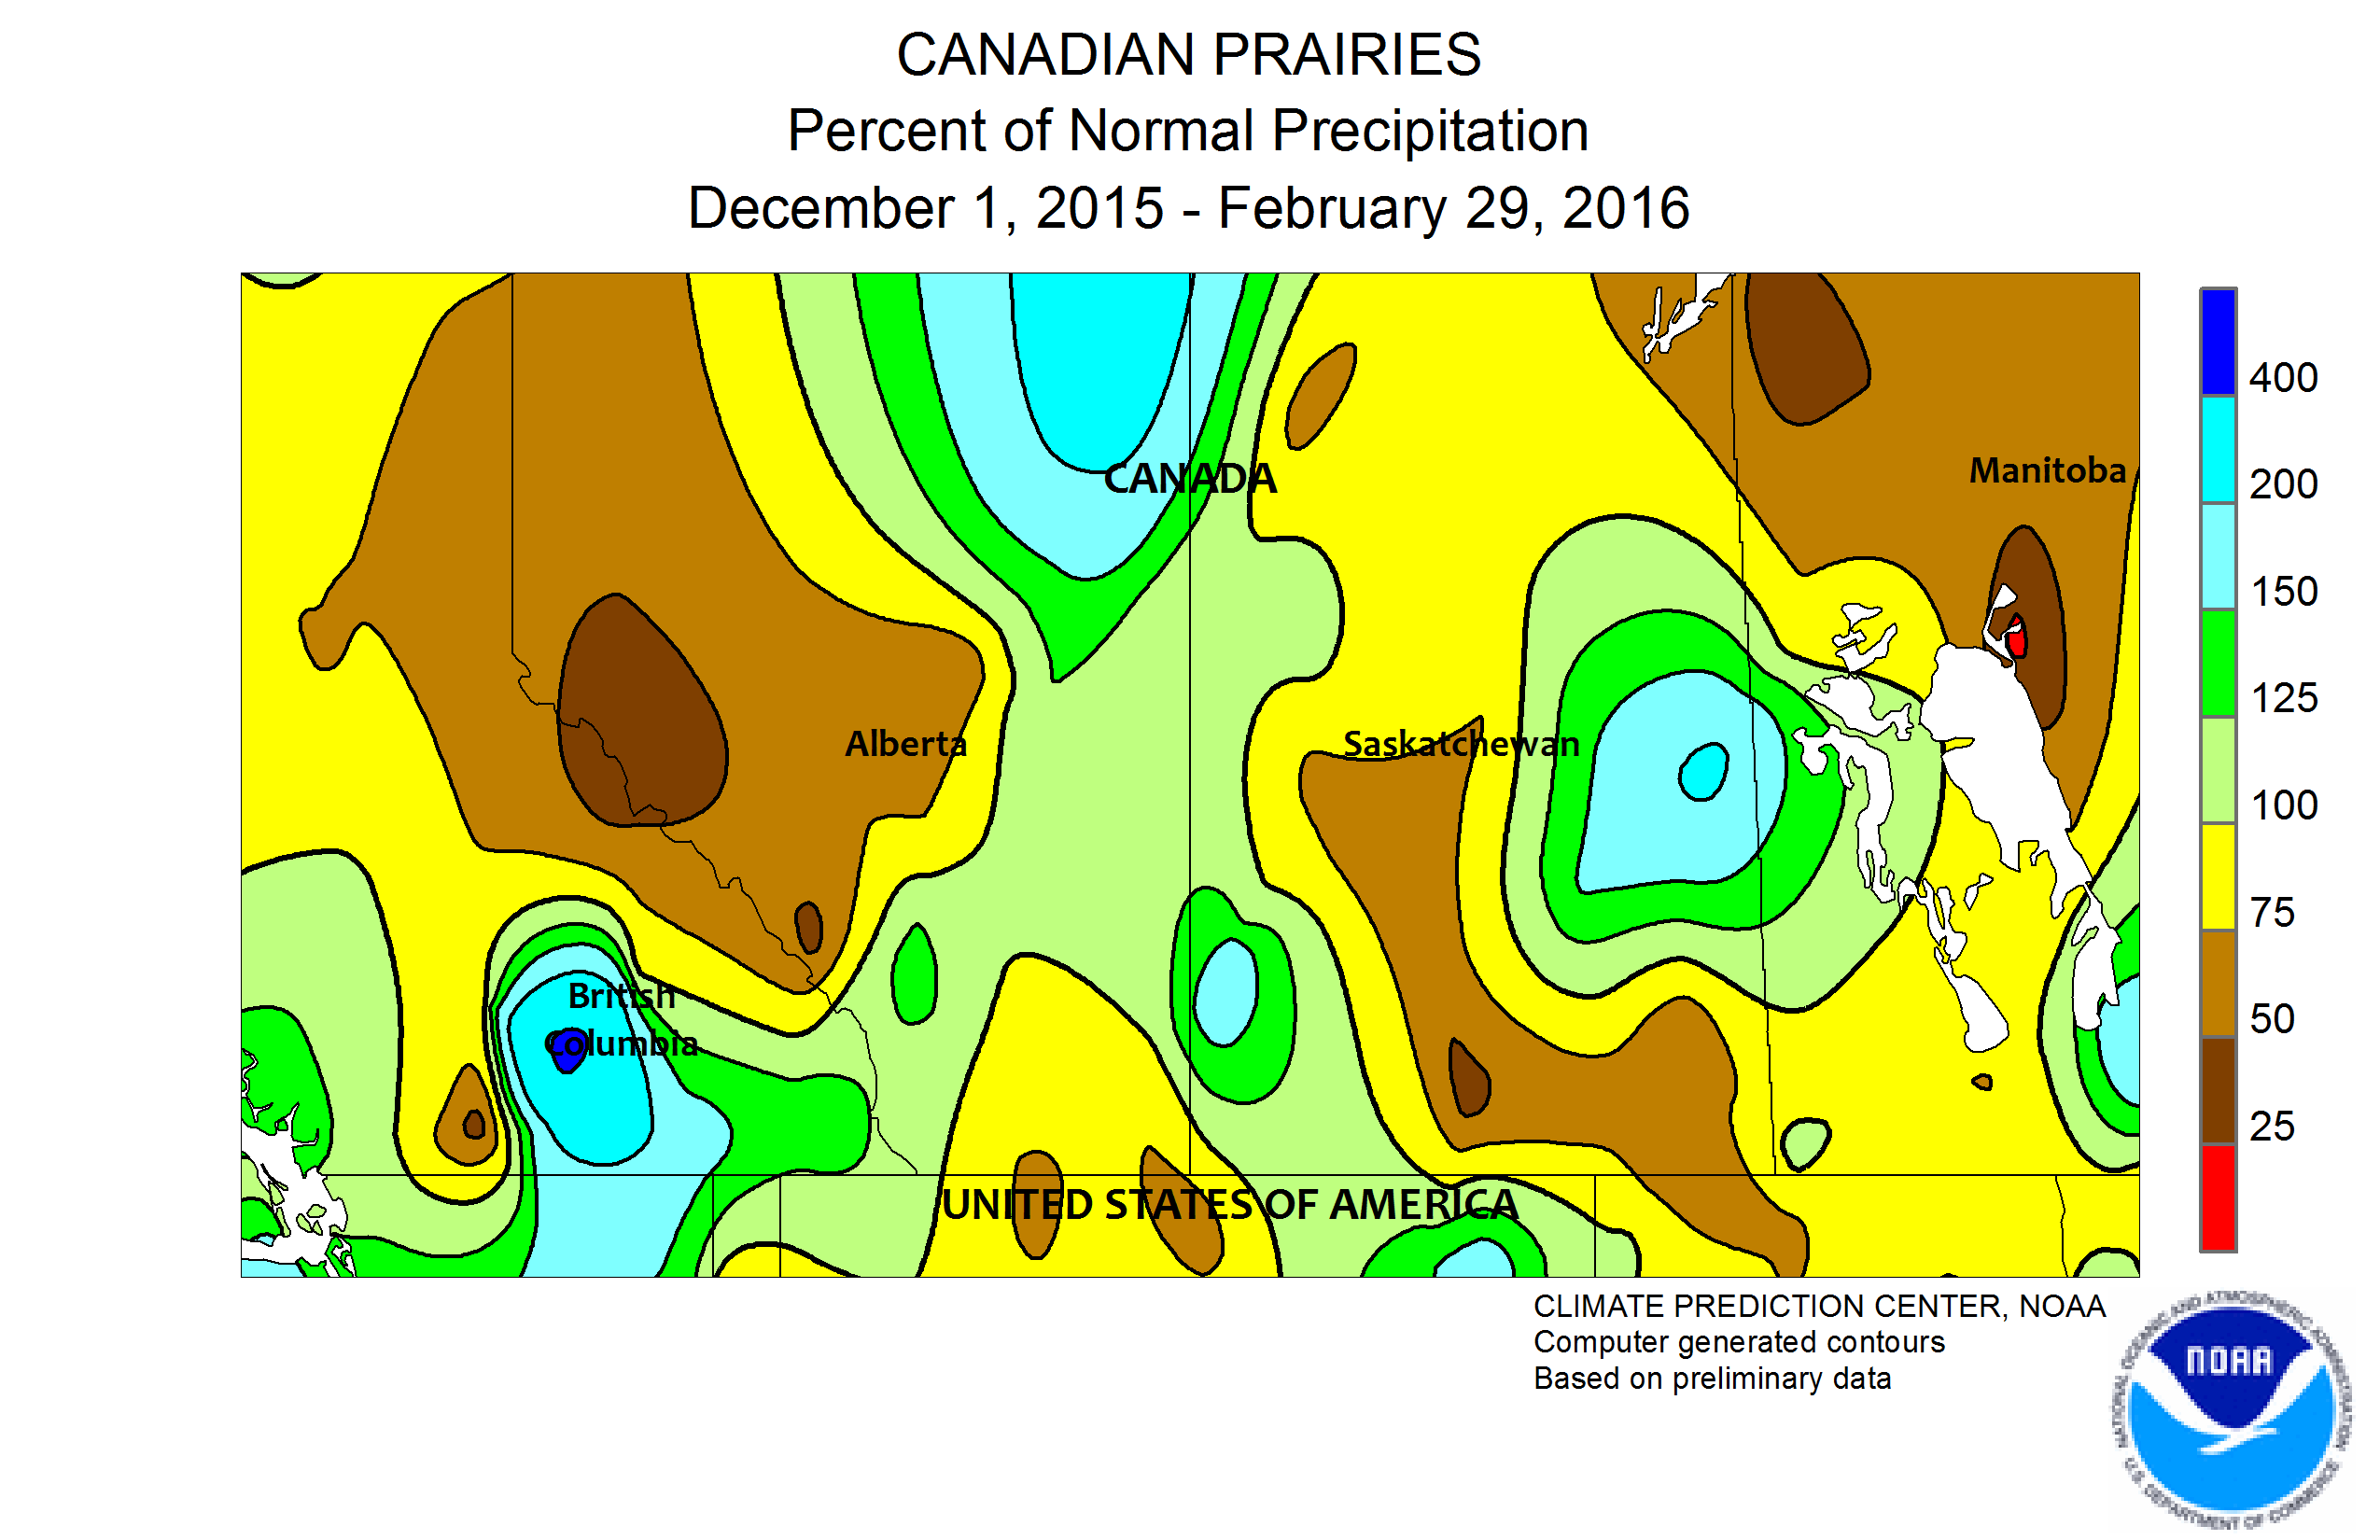
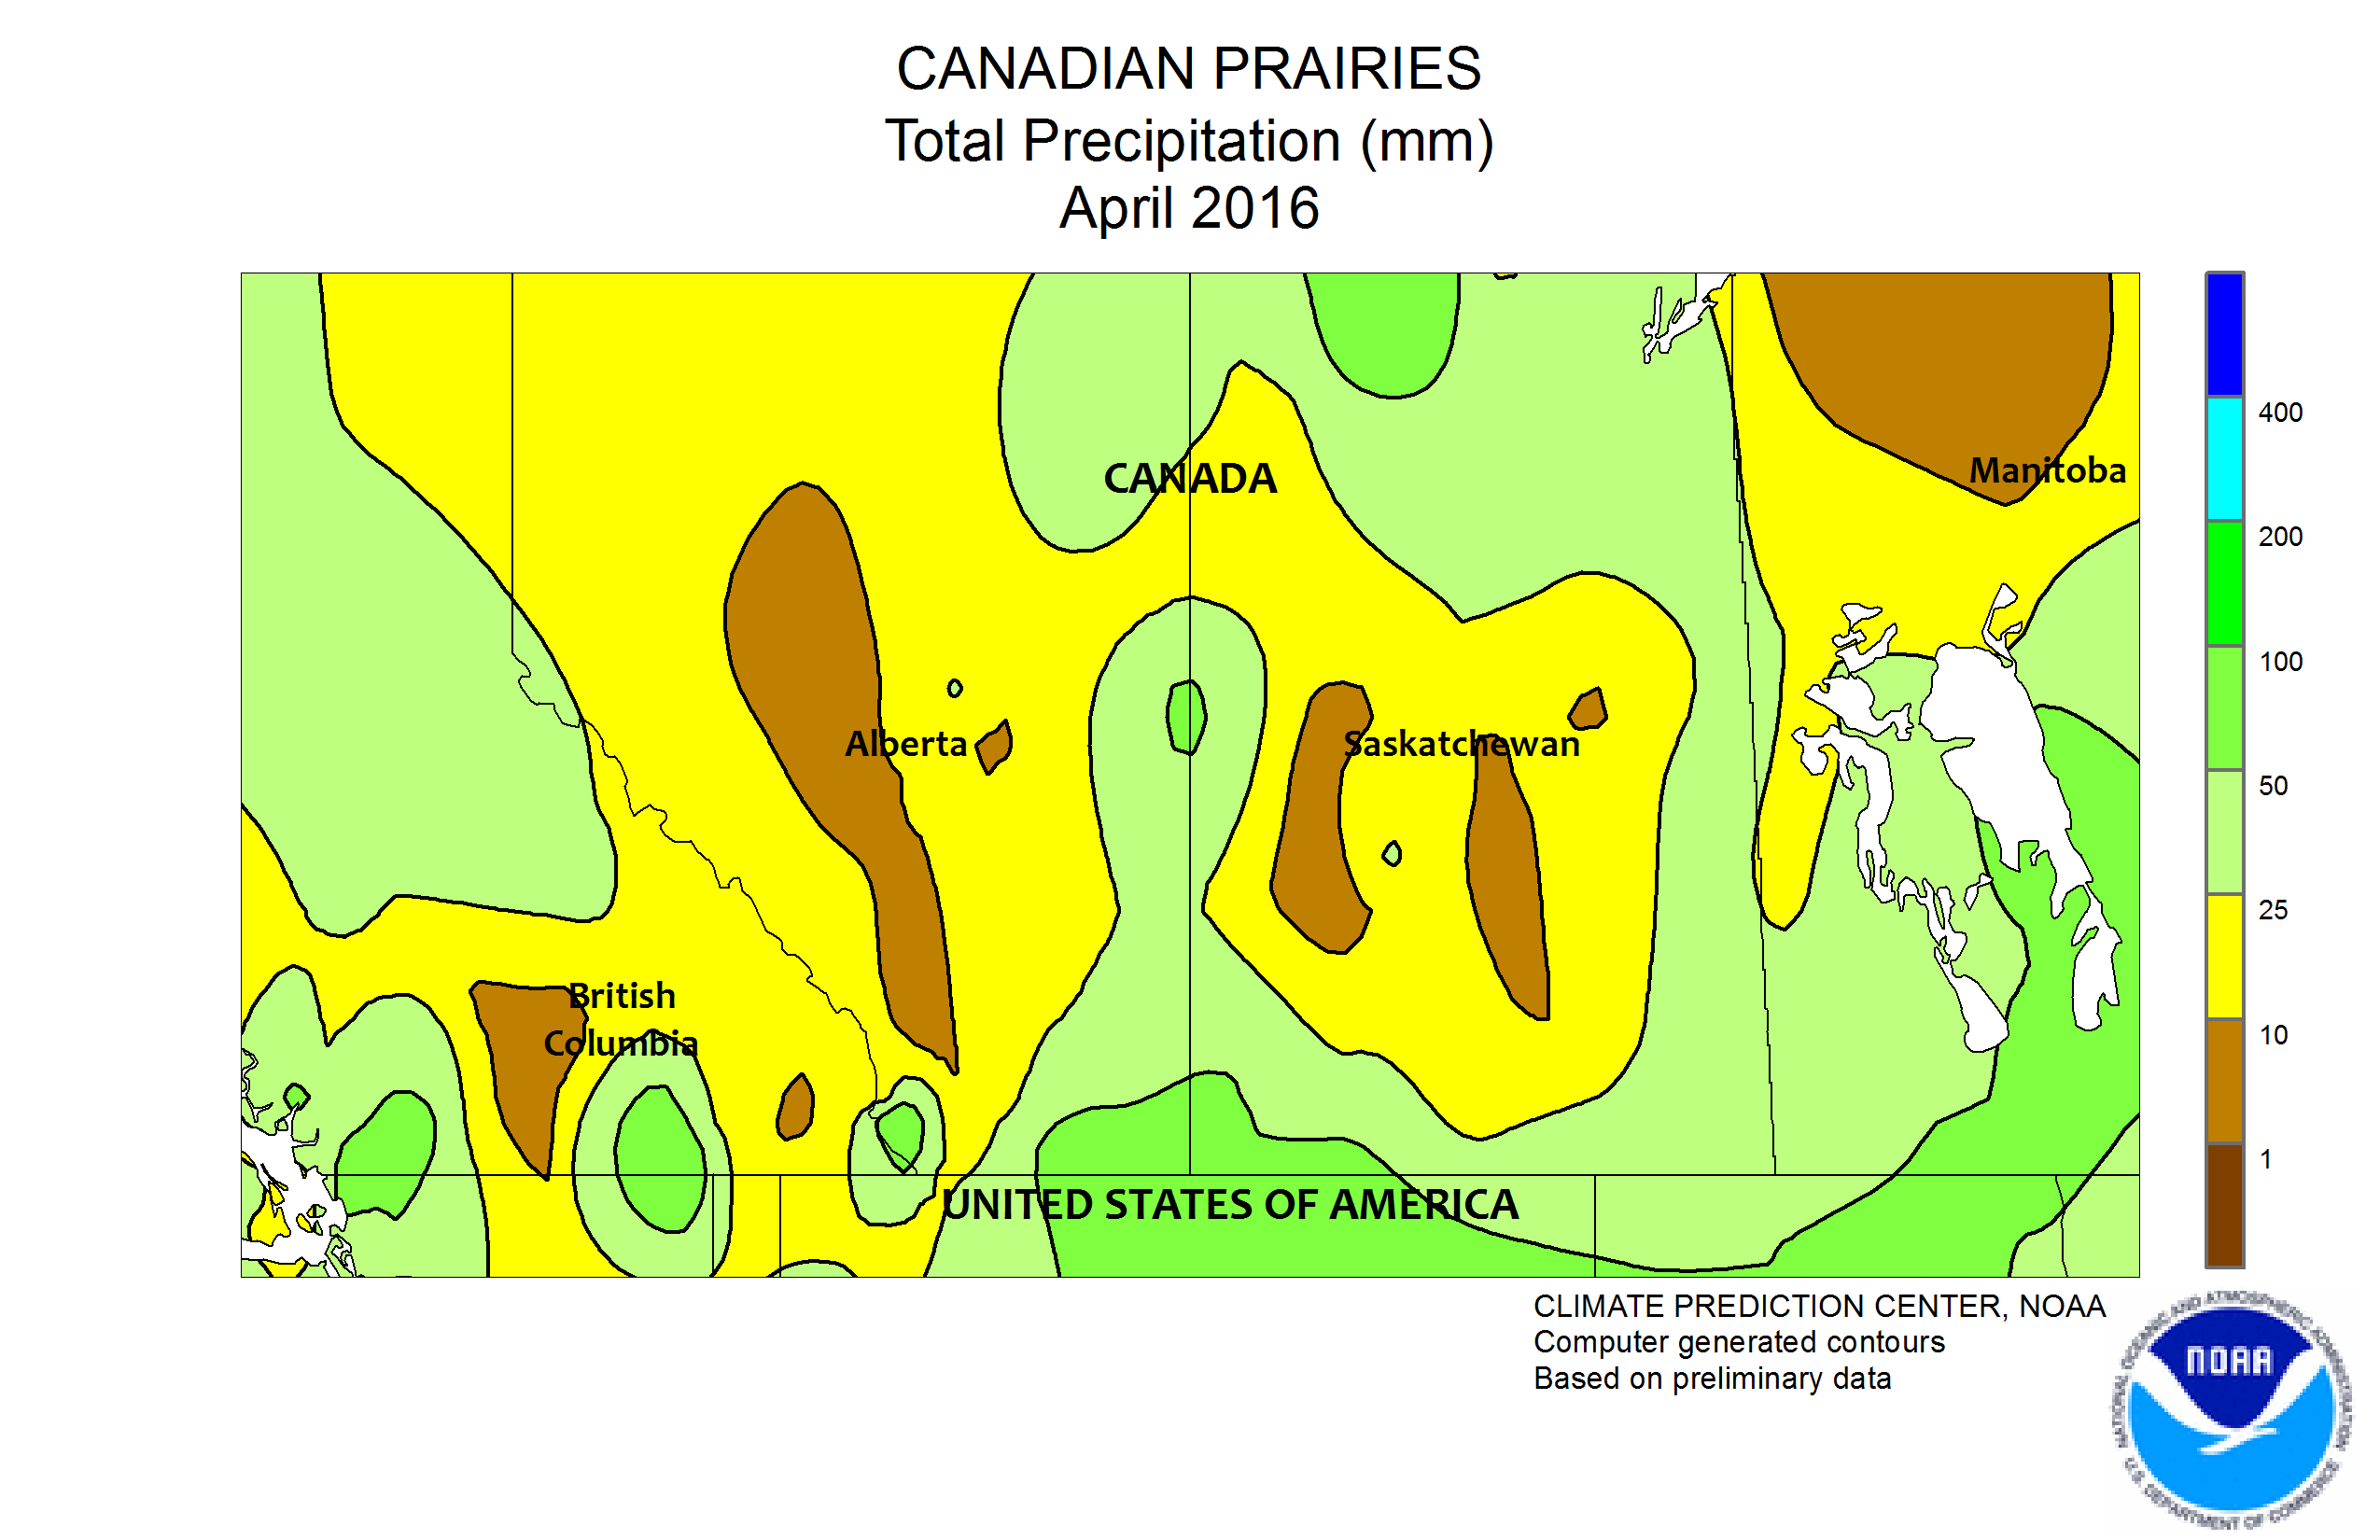
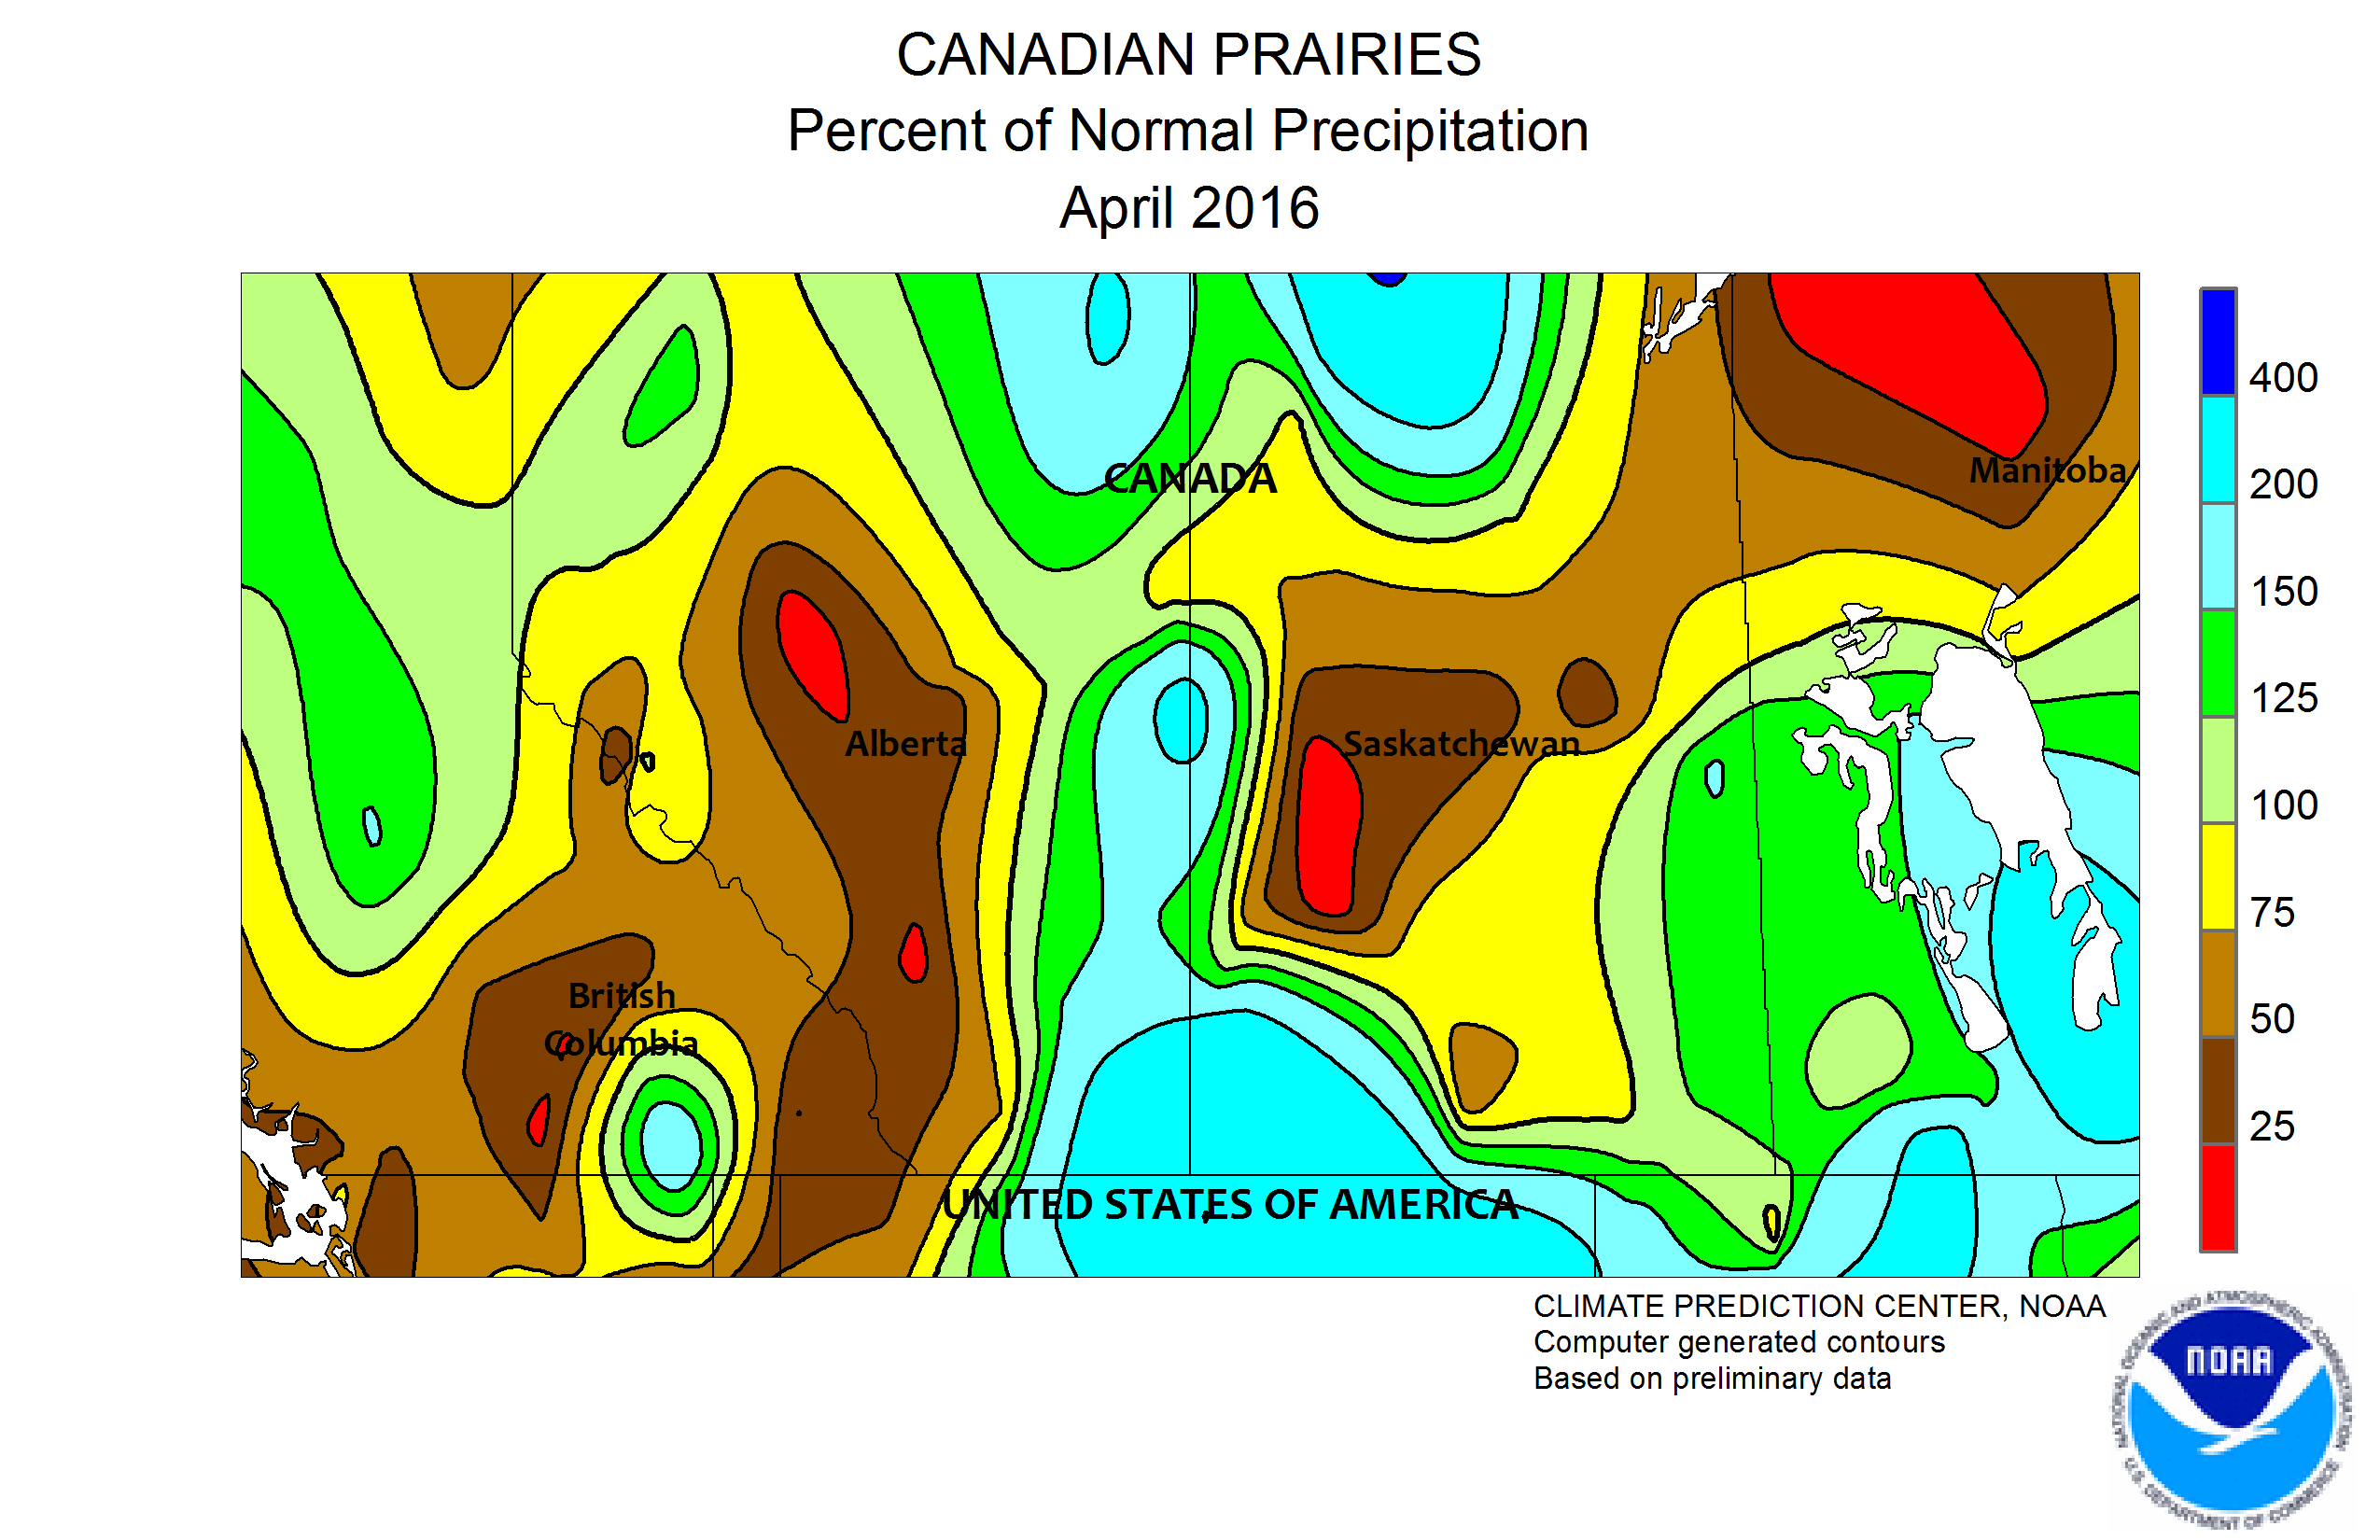
Situation in Canada Canada's West experienced a very mild and snow-lacking winter (i.e. 43 mm of precipitation in Fort McMurry from December 2015 to April 2016, on average: 82 mm). The maps of the geopotential show a slightly pronounced ridge over Western Canada. This year (March 29th to May 10th), the ridge over Western Canada was considerably more pronounced. In the six week period from March 29th to May 10th, positive geopotential anomalies from 8 – 10 dam were analysed over Western Canada. Because of increased sinking processes and a more stable atmospheric layer, the amount of precipitation has been lower than normal. The dryness combined with unusual high temperatures and a windy weather provided good preconditions for the spreading of wildfires.
At the weather station in Fort McMurray CS, no precipitation was measured since April 26th. The last bigger precipitation event with 10,8 mm happened on April 13th and 21,2 mm of rain was recorded since the 1st of April. Only 72,0 mm of rainfall was obsverved since the beginning of the year.
The winter, with only 75 % of the long-term average precipitation, was too dry in several areas in Canada. In some areas the average precipitation was recorded as less than 50 %, and in central Manitoba less than 25 %. In Alberta, the winter was too dry especially in the Southwest of the province (60 – 85 % of the average). Local amounts were even at only 25 – 40 % of the long-term winter precipitation. Low river levels and possibly record-breaking low water equivalent of the snow cover were impacts of the warm and dry weather. At the Athabasca River (flows through McMurray), the water equivalent of the snow cover on May 1st was 63 mm at the station Marmot-Jasper (1830 m above sea level). On May 1st the average snow cover was 219 mm. This years value is only at 29 % of the mean and is the second lowest value in the last 47 years. The weather station Sunwapta Falls (1400 m above sea level), which is also situated at the Athabasca River, recorded no snow at all. In the 47 year long measuring period this only happened in the year 1980. The average value is 118 mm.
At the beginning of Mai, a high ridge once again established over the West of North America. It transported hot air (over 20 °C in 850 hPa) to the western part of Canada (as far north as the southern part of the Hudson Bay). The 0 °C isotherm covered the whole western part of Canada up to the northern coast (Canadian Arctic Archipelago). The temperatures rose to almost 33 °C in Fort McMurray on the 3rd of May (long tearm mean at the beginning of May: 15 °C). The daily record of 28 °C that lasted for 71 years was surpassed considerably. Only on five days in the year and usually not before July and August do temperatures rise to that level (mean average 21-24 °C) (Source: Wunderground). In the region, April and May are the windiest months, but wildfires in the boreal forests are usually not happening before July and August. After the fast snow melt in the last weeks, the vegetation was dry and not yet green.
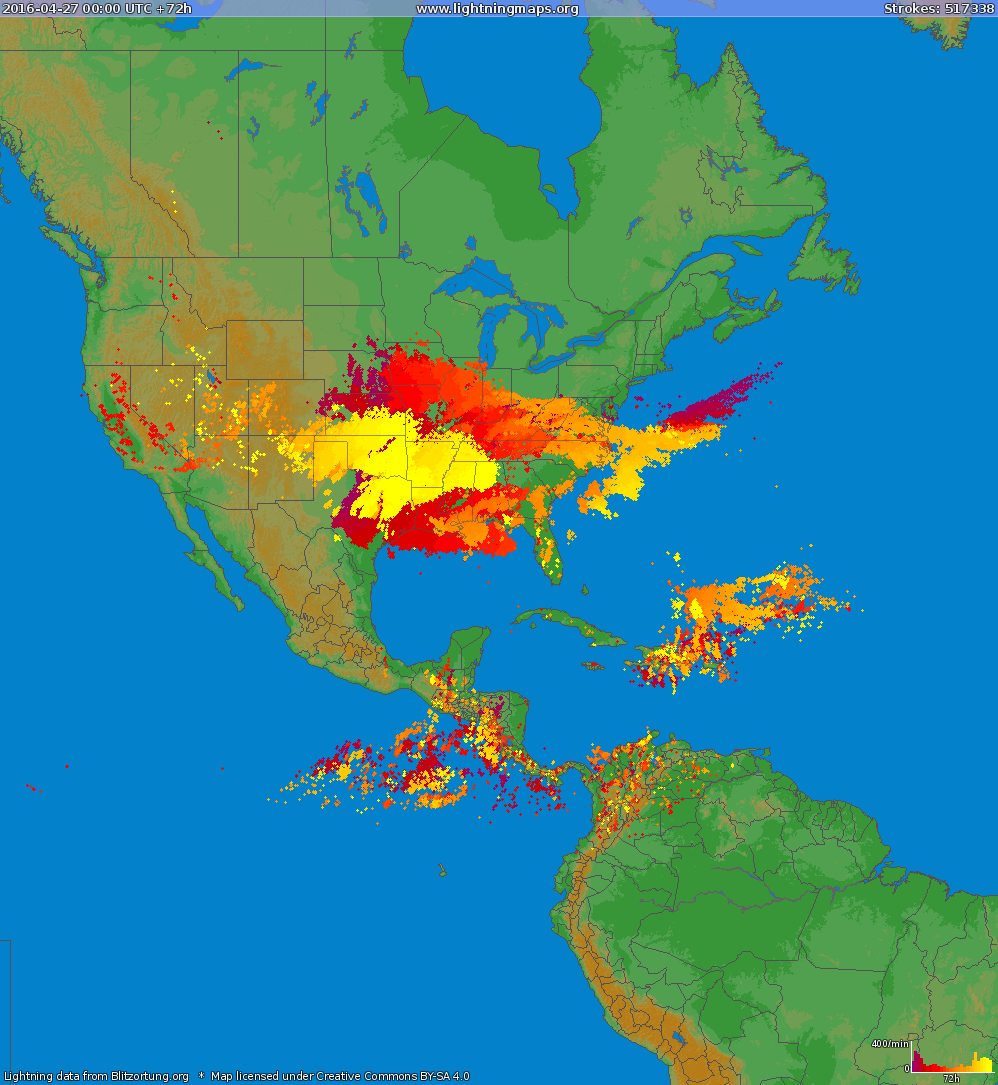
On May 1st, a wildfire started about 15 km outside of Fort McMurray. Lightning maps show that in the area of Fort McMurray single lightning strikes were registered on April 27th. Possibly, a lightning strike was the trigger for the devastating wildfires. Smaller fires (yellow points, < 100 ha) are visible on the analysis maps for North America on April 17th. On April 20th bigger fires (orange points, 101 – 1000 ha) occured in Eastern British Columbia. The map shows even larger wildfires in Alberta on May 2nd (red points, > 1000 ha) and under it, the severe fires of Fort McMurray. On May 11th the fire danger was moderate (green), high (yellow), very high (orange) up to extreme (red). The heat, the dry history and vegetation, very dry air (under 10 % relative humidity) and strong winds (54 km/h on average, Bft 7, 72 km/h in gusts, Bft 8 on May 4th with temperatures of 32 °C) favored the formation of a major fire. The fire demanded all national and, to some extent military capacities of the action force and got through the fast increase of the affected area out of control. After the passage of the first cold front on May 5th, the temperatures rose again considerably. A second cold front enabled the fire fighters to gradually contain the wildfire. Before the cold front went through, the fire expanded to an area of 3000 km² and the province of Saskatchewan was endangered. On top of that, there was a danger of explosions close to the nearby oil refineries. The production of oil had to be stopped (the area produces 25 % of the production of the entire country). Despite the latest developments, the fire could last for many more weeks or months.
Transl.: JW 13. Mai 2016 |
||||||||||||||||||||||||||||||||||||||||||||||||||||||||||||||||||||||||||||||||||||||||||||||||||||||||||||||||||||||||||||||||||||||